Central American vs Immigrants from Sudan Child Poverty Under the Age of 5
COMPARE
Central American
Immigrants from Sudan
Child Poverty Under the Age of 5
Child Poverty Under the Age of 5 Comparison
Central Americans
Immigrants from Sudan
20.6%
CHILD POVERTY UNDER THE AGE OF 5
0.1/ 100
METRIC RATING
273rd/ 347
METRIC RANK
19.2%
CHILD POVERTY UNDER THE AGE OF 5
1.3/ 100
METRIC RATING
228th/ 347
METRIC RANK
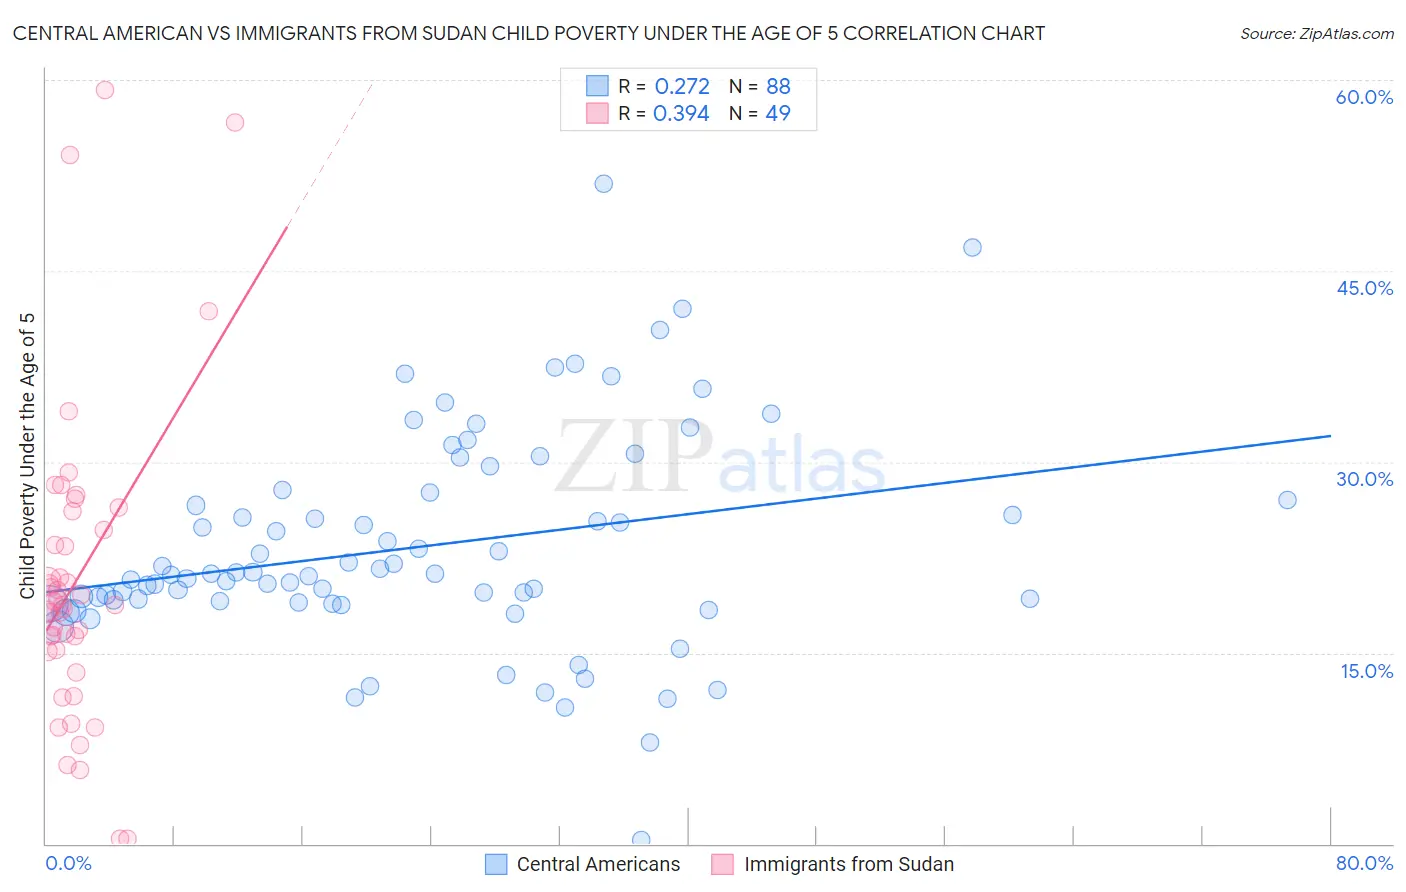
Central American vs Immigrants from Sudan Child Poverty Under the Age of 5 Correlation Chart
The statistical analysis conducted on geographies consisting of 480,879,905 people shows a weak positive correlation between the proportion of Central Americans and poverty level among children under the age of 5 in the United States with a correlation coefficient (R) of 0.272 and weighted average of 20.6%. Similarly, the statistical analysis conducted on geographies consisting of 117,972,836 people shows a mild positive correlation between the proportion of Immigrants from Sudan and poverty level among children under the age of 5 in the United States with a correlation coefficient (R) of 0.394 and weighted average of 19.2%, a difference of 7.4%.
Child Poverty Under the Age of 5 Correlation Summary
| Measurement | Central American | Immigrants from Sudan |
| Minimum | 0.31% | 0.35% |
| Maximum | 51.8% | 59.2% |
| Range | 51.5% | 58.9% |
| Mean | 23.3% | 20.7% |
| Median | 21.2% | 18.8% |
| Interquartile 25% (IQ1) | 19.0% | 15.2% |
| Interquartile 75% (IQ3) | 27.3% | 25.4% |
| Interquartile Range (IQR) | 8.3% | 10.2% |
| Standard Deviation (Sample) | 8.5% | 12.2% |
| Standard Deviation (Population) | 8.5% | 12.1% |
Similar Demographics by Child Poverty Under the Age of 5
Demographics Similar to Central Americans by Child Poverty Under the Age of 5
In terms of child poverty under the age of 5, the demographic groups most similar to Central Americans are Immigrants from Belize (20.6%, a difference of 0.10%), Bangladeshi (20.6%, a difference of 0.15%), West Indian (20.6%, a difference of 0.24%), Immigrants from West Indies (20.7%, a difference of 0.41%), and Immigrants from Grenada (20.7%, a difference of 0.43%).
| Demographics | Rating | Rank | Child Poverty Under the Age of 5 |
| Aleuts | 0.1 /100 | #266 | Tragic 20.3% |
| Ottawa | 0.1 /100 | #267 | Tragic 20.3% |
| Belizeans | 0.1 /100 | #268 | Tragic 20.3% |
| Immigrants | Burma/Myanmar | 0.1 /100 | #269 | Tragic 20.4% |
| Jamaicans | 0.1 /100 | #270 | Tragic 20.4% |
| Americans | 0.1 /100 | #271 | Tragic 20.5% |
| Immigrants | Jamaica | 0.1 /100 | #272 | Tragic 20.5% |
| Central Americans | 0.1 /100 | #273 | Tragic 20.6% |
| Immigrants | Belize | 0.1 /100 | #274 | Tragic 20.6% |
| Bangladeshis | 0.1 /100 | #275 | Tragic 20.6% |
| West Indians | 0.0 /100 | #276 | Tragic 20.6% |
| Immigrants | West Indies | 0.0 /100 | #277 | Tragic 20.7% |
| Immigrants | Grenada | 0.0 /100 | #278 | Tragic 20.7% |
| Sub-Saharan Africans | 0.0 /100 | #279 | Tragic 20.8% |
| French American Indians | 0.0 /100 | #280 | Tragic 20.8% |
Demographics Similar to Immigrants from Sudan by Child Poverty Under the Age of 5
In terms of child poverty under the age of 5, the demographic groups most similar to Immigrants from Sudan are Ghanaian (19.2%, a difference of 0.080%), Ecuadorian (19.2%, a difference of 0.12%), Bermudan (19.2%, a difference of 0.17%), Cape Verdean (19.1%, a difference of 0.30%), and Immigrants from Eritrea (19.1%, a difference of 0.49%).
| Demographics | Rating | Rank | Child Poverty Under the Age of 5 |
| Immigrants | Nigeria | 2.1 /100 | #221 | Tragic 19.0% |
| Alsatians | 1.7 /100 | #222 | Tragic 19.1% |
| Cubans | 1.7 /100 | #223 | Tragic 19.1% |
| Nicaraguans | 1.6 /100 | #224 | Tragic 19.1% |
| Nigerians | 1.6 /100 | #225 | Tragic 19.1% |
| Immigrants | Eritrea | 1.5 /100 | #226 | Tragic 19.1% |
| Cape Verdeans | 1.4 /100 | #227 | Tragic 19.1% |
| Immigrants | Sudan | 1.3 /100 | #228 | Tragic 19.2% |
| Ghanaians | 1.2 /100 | #229 | Tragic 19.2% |
| Ecuadorians | 1.2 /100 | #230 | Tragic 19.2% |
| Bermudans | 1.2 /100 | #231 | Tragic 19.2% |
| Trinidadians and Tobagonians | 0.9 /100 | #232 | Tragic 19.3% |
| Sudanese | 0.9 /100 | #233 | Tragic 19.3% |
| Immigrants | Micronesia | 0.9 /100 | #234 | Tragic 19.4% |
| Immigrants | Laos | 0.8 /100 | #235 | Tragic 19.4% |