Central American vs Eastern European Female Disability
COMPARE
Central American
Eastern European
Female Disability
Female Disability Comparison
Central Americans
Eastern Europeans
11.9%
FEMALE DISABILITY
94.2/ 100
METRIC RATING
135th/ 347
METRIC RANK
11.5%
FEMALE DISABILITY
99.7/ 100
METRIC RATING
81st/ 347
METRIC RANK
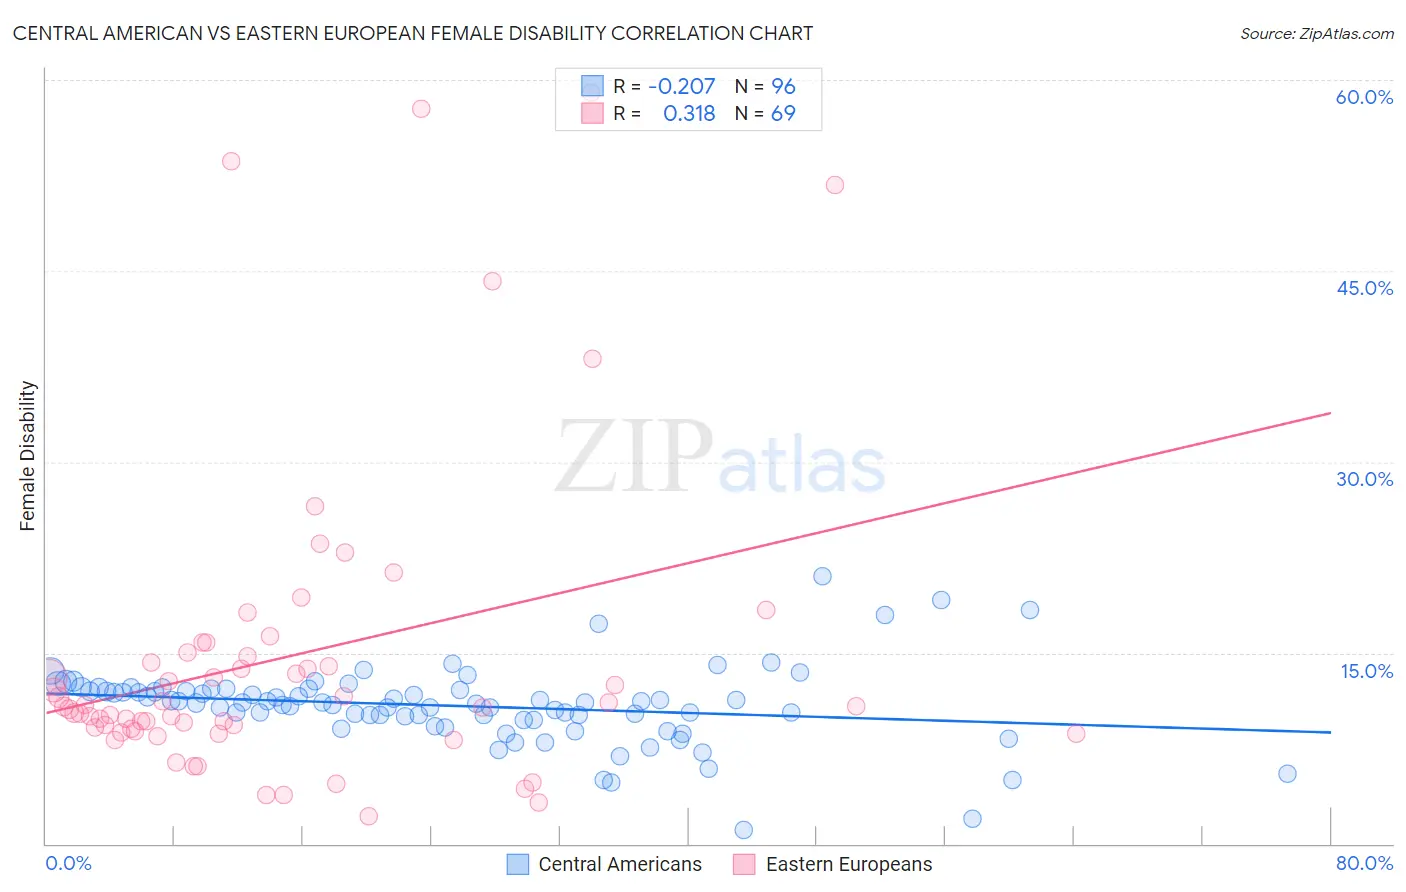
Central American vs Eastern European Female Disability Correlation Chart
The statistical analysis conducted on geographies consisting of 504,442,047 people shows a weak negative correlation between the proportion of Central Americans and percentage of females with a disability in the United States with a correlation coefficient (R) of -0.207 and weighted average of 11.9%. Similarly, the statistical analysis conducted on geographies consisting of 461,176,022 people shows a mild positive correlation between the proportion of Eastern Europeans and percentage of females with a disability in the United States with a correlation coefficient (R) of 0.318 and weighted average of 11.5%, a difference of 2.9%.
Female Disability Correlation Summary
| Measurement | Central American | Eastern European |
| Minimum | 1.0% | 2.2% |
| Maximum | 21.1% | 59.0% |
| Range | 20.0% | 56.8% |
| Mean | 10.8% | 14.7% |
| Median | 11.1% | 10.8% |
| Interquartile 25% (IQ1) | 9.9% | 8.9% |
| Interquartile 75% (IQ3) | 12.1% | 14.8% |
| Interquartile Range (IQR) | 2.2% | 5.9% |
| Standard Deviation (Sample) | 3.0% | 12.3% |
| Standard Deviation (Population) | 3.0% | 12.2% |
Similar Demographics by Female Disability
Demographics Similar to Central Americans by Female Disability
In terms of female disability, the demographic groups most similar to Central Americans are Ugandan (11.9%, a difference of 0.030%), Immigrants from Norway (11.9%, a difference of 0.060%), Kenyan (11.9%, a difference of 0.070%), Immigrants from Nicaragua (11.9%, a difference of 0.070%), and Immigrants from Syria (11.9%, a difference of 0.080%).
| Demographics | Rating | Rank | Female Disability |
| Immigrants | Latvia | 95.6 /100 | #128 | Exceptional 11.8% |
| Macedonians | 95.5 /100 | #129 | Exceptional 11.8% |
| Nicaraguans | 95.2 /100 | #130 | Exceptional 11.9% |
| Arabs | 95.1 /100 | #131 | Exceptional 11.9% |
| Immigrants | Syria | 94.6 /100 | #132 | Exceptional 11.9% |
| Kenyans | 94.5 /100 | #133 | Exceptional 11.9% |
| Immigrants | Nicaragua | 94.5 /100 | #134 | Exceptional 11.9% |
| Central Americans | 94.2 /100 | #135 | Exceptional 11.9% |
| Ugandans | 94.0 /100 | #136 | Exceptional 11.9% |
| Immigrants | Norway | 93.8 /100 | #137 | Exceptional 11.9% |
| Ecuadorians | 93.4 /100 | #138 | Exceptional 11.9% |
| Immigrants | Hungary | 92.8 /100 | #139 | Exceptional 11.9% |
| Romanians | 91.6 /100 | #140 | Exceptional 11.9% |
| Immigrants | Ecuador | 91.5 /100 | #141 | Exceptional 11.9% |
| Immigrants | Africa | 90.0 /100 | #142 | Excellent 11.9% |
Demographics Similar to Eastern Europeans by Female Disability
In terms of female disability, the demographic groups most similar to Eastern Europeans are Immigrants from Jordan (11.5%, a difference of 0.14%), Sierra Leonean (11.5%, a difference of 0.15%), Immigrants from South Africa (11.5%, a difference of 0.17%), Immigrants from Eritrea (11.5%, a difference of 0.18%), and Immigrants from Afghanistan (11.5%, a difference of 0.18%).
| Demographics | Rating | Rank | Female Disability |
| Bhutanese | 99.8 /100 | #74 | Exceptional 11.5% |
| Immigrants | Lebanon | 99.7 /100 | #75 | Exceptional 11.5% |
| Immigrants | Eritrea | 99.7 /100 | #76 | Exceptional 11.5% |
| Immigrants | Afghanistan | 99.7 /100 | #77 | Exceptional 11.5% |
| Immigrants | South Africa | 99.7 /100 | #78 | Exceptional 11.5% |
| Sierra Leoneans | 99.7 /100 | #79 | Exceptional 11.5% |
| Immigrants | Jordan | 99.7 /100 | #80 | Exceptional 11.5% |
| Eastern Europeans | 99.7 /100 | #81 | Exceptional 11.5% |
| Luxembourgers | 99.6 /100 | #82 | Exceptional 11.6% |
| Immigrants | Serbia | 99.6 /100 | #83 | Exceptional 11.6% |
| Immigrants | Poland | 99.6 /100 | #84 | Exceptional 11.6% |
| Palestinians | 99.6 /100 | #85 | Exceptional 11.6% |
| Immigrants | Cameroon | 99.6 /100 | #86 | Exceptional 11.6% |
| Immigrants | Denmark | 99.5 /100 | #87 | Exceptional 11.6% |
| Yup'ik | 99.5 /100 | #88 | Exceptional 11.6% |