Central American vs Basque College, Under 1 year
COMPARE
Central American
Basque
College, Under 1 year
College, Under 1 year Comparison
Central Americans
Basques
57.7%
COLLEGE, UNDER 1 YEAR
0.0/ 100
METRIC RATING
308th/ 347
METRIC RANK
67.6%
COLLEGE, UNDER 1 YEAR
95.2/ 100
METRIC RATING
115th/ 347
METRIC RANK
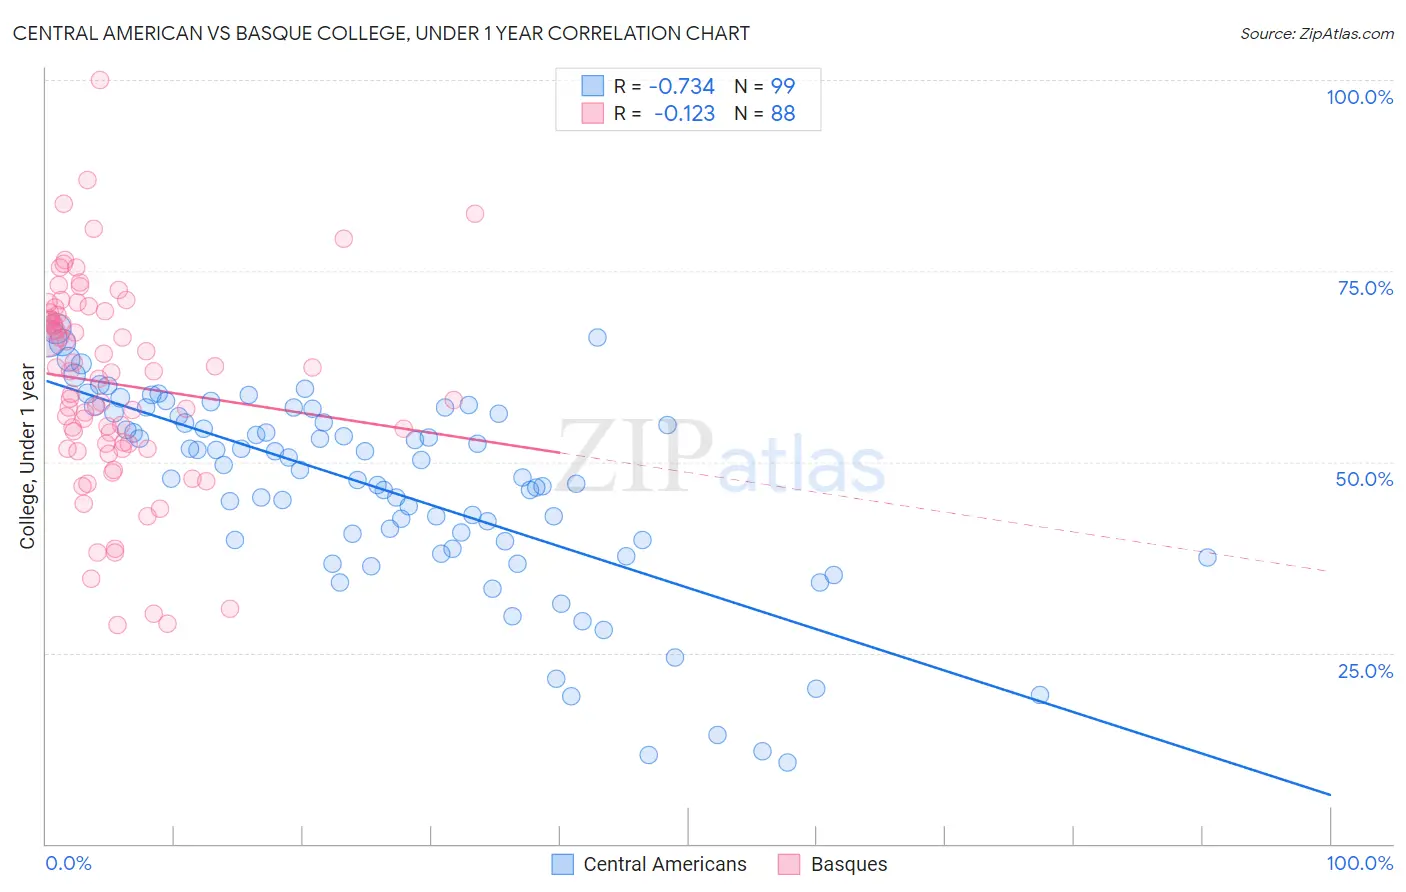
Central American vs Basque College, Under 1 year Correlation Chart
The statistical analysis conducted on geographies consisting of 504,615,987 people shows a strong negative correlation between the proportion of Central Americans and percentage of population with at least college, under 1 year education in the United States with a correlation coefficient (R) of -0.734 and weighted average of 57.7%. Similarly, the statistical analysis conducted on geographies consisting of 165,778,801 people shows a poor negative correlation between the proportion of Basques and percentage of population with at least college, under 1 year education in the United States with a correlation coefficient (R) of -0.123 and weighted average of 67.6%, a difference of 17.2%.
College, Under 1 year Correlation Summary
| Measurement | Central American | Basque |
| Minimum | 10.7% | 28.6% |
| Maximum | 67.5% | 100.0% |
| Range | 56.8% | 71.4% |
| Mean | 46.4% | 60.2% |
| Median | 48.9% | 61.8% |
| Interquartile 25% (IQ1) | 39.6% | 52.1% |
| Interquartile 75% (IQ3) | 56.3% | 69.4% |
| Interquartile Range (IQR) | 16.7% | 17.3% |
| Standard Deviation (Sample) | 13.0% | 13.5% |
| Standard Deviation (Population) | 12.9% | 13.4% |
Similar Demographics by College, Under 1 year
Demographics Similar to Central Americans by College, Under 1 year
In terms of college, under 1 year, the demographic groups most similar to Central Americans are Fijian (57.7%, a difference of 0.0%), Immigrants from Portugal (57.7%, a difference of 0.010%), Immigrants from Nicaragua (57.6%, a difference of 0.12%), Haitian (57.8%, a difference of 0.21%), and Kiowa (57.8%, a difference of 0.32%).
| Demographics | Rating | Rank | College, Under 1 year |
| Mexican American Indians | 0.0 /100 | #301 | Tragic 58.1% |
| Apache | 0.0 /100 | #302 | Tragic 58.0% |
| Immigrants | Dominica | 0.0 /100 | #303 | Tragic 57.9% |
| Kiowa | 0.0 /100 | #304 | Tragic 57.8% |
| Haitians | 0.0 /100 | #305 | Tragic 57.8% |
| Immigrants | Portugal | 0.0 /100 | #306 | Tragic 57.7% |
| Fijians | 0.0 /100 | #307 | Tragic 57.7% |
| Central Americans | 0.0 /100 | #308 | Tragic 57.7% |
| Immigrants | Nicaragua | 0.0 /100 | #309 | Tragic 57.6% |
| Pueblo | 0.0 /100 | #310 | Tragic 57.4% |
| Cajuns | 0.0 /100 | #311 | Tragic 57.3% |
| Salvadorans | 0.0 /100 | #312 | Tragic 57.3% |
| Dutch West Indians | 0.0 /100 | #313 | Tragic 57.2% |
| Hopi | 0.0 /100 | #314 | Tragic 57.1% |
| Hondurans | 0.0 /100 | #315 | Tragic 57.1% |
Demographics Similar to Basques by College, Under 1 year
In terms of college, under 1 year, the demographic groups most similar to Basques are Chilean (67.6%, a difference of 0.010%), Immigrants from Nepal (67.5%, a difference of 0.080%), Syrian (67.6%, a difference of 0.090%), Pakistani (67.5%, a difference of 0.10%), and Macedonian (67.6%, a difference of 0.11%).
| Demographics | Rating | Rank | College, Under 1 year |
| Immigrants | Egypt | 96.0 /100 | #108 | Exceptional 67.7% |
| Scandinavians | 95.8 /100 | #109 | Exceptional 67.7% |
| Assyrians/Chaldeans/Syriacs | 95.8 /100 | #110 | Exceptional 67.7% |
| Ukrainians | 95.8 /100 | #111 | Exceptional 67.7% |
| Macedonians | 95.7 /100 | #112 | Exceptional 67.6% |
| Syrians | 95.6 /100 | #113 | Exceptional 67.6% |
| Chileans | 95.3 /100 | #114 | Exceptional 67.6% |
| Basques | 95.2 /100 | #115 | Exceptional 67.6% |
| Immigrants | Nepal | 94.9 /100 | #116 | Exceptional 67.5% |
| Pakistanis | 94.8 /100 | #117 | Exceptional 67.5% |
| Immigrants | Ukraine | 94.7 /100 | #118 | Exceptional 67.5% |
| Lebanese | 94.6 /100 | #119 | Exceptional 67.5% |
| Serbians | 93.9 /100 | #120 | Exceptional 67.4% |
| Slovenes | 93.3 /100 | #121 | Exceptional 67.3% |
| Immigrants | Jordan | 92.8 /100 | #122 | Exceptional 67.3% |