Immigrants from Lithuania vs Basque Male Disability
COMPARE
Immigrants from Lithuania
Basque
Male Disability
Male Disability Comparison
Immigrants from Lithuania
Basques
10.5%
MALE DISABILITY
98.9/ 100
METRIC RATING
73rd/ 347
METRIC RANK
12.1%
MALE DISABILITY
0.3/ 100
METRIC RATING
258th/ 347
METRIC RANK
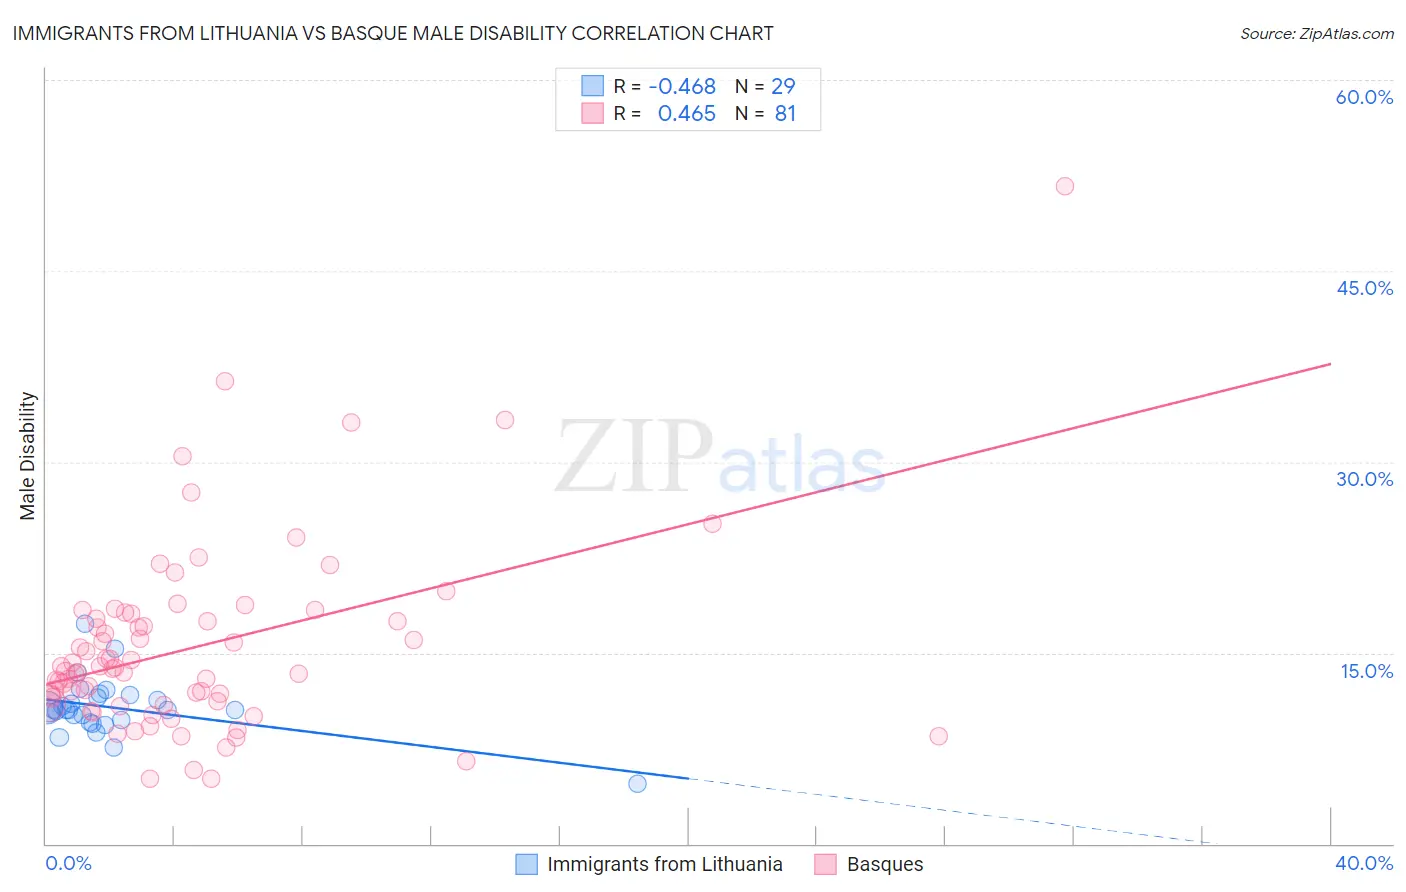
Immigrants from Lithuania vs Basque Male Disability Correlation Chart
The statistical analysis conducted on geographies consisting of 117,723,039 people shows a moderate negative correlation between the proportion of Immigrants from Lithuania and percentage of males with a disability in the United States with a correlation coefficient (R) of -0.468 and weighted average of 10.5%. Similarly, the statistical analysis conducted on geographies consisting of 165,777,747 people shows a moderate positive correlation between the proportion of Basques and percentage of males with a disability in the United States with a correlation coefficient (R) of 0.465 and weighted average of 12.1%, a difference of 15.3%.
Male Disability Correlation Summary
| Measurement | Immigrants from Lithuania | Basque |
| Minimum | 4.7% | 5.1% |
| Maximum | 17.2% | 51.7% |
| Range | 12.5% | 46.6% |
| Mean | 10.7% | 15.4% |
| Median | 10.5% | 13.8% |
| Interquartile 25% (IQ1) | 9.6% | 11.1% |
| Interquartile 75% (IQ3) | 11.6% | 17.9% |
| Interquartile Range (IQR) | 2.0% | 6.7% |
| Standard Deviation (Sample) | 2.2% | 7.4% |
| Standard Deviation (Population) | 2.2% | 7.3% |
Similar Demographics by Male Disability
Demographics Similar to Immigrants from Lithuania by Male Disability
In terms of male disability, the demographic groups most similar to Immigrants from Lithuania are Immigrants from Serbia (10.5%, a difference of 0.060%), Immigrants from Cameroon (10.5%, a difference of 0.12%), Immigrants from Lebanon (10.5%, a difference of 0.14%), Sierra Leonean (10.5%, a difference of 0.26%), and Immigrants from Bulgaria (10.5%, a difference of 0.27%).
| Demographics | Rating | Rank | Male Disability |
| Guyanese | 99.2 /100 | #66 | Exceptional 10.5% |
| Immigrants | Afghanistan | 99.2 /100 | #67 | Exceptional 10.5% |
| Colombians | 99.2 /100 | #68 | Exceptional 10.5% |
| Ecuadorians | 99.2 /100 | #69 | Exceptional 10.5% |
| Immigrants | Bulgaria | 99.1 /100 | #70 | Exceptional 10.5% |
| Immigrants | Cameroon | 99.0 /100 | #71 | Exceptional 10.5% |
| Immigrants | Serbia | 99.0 /100 | #72 | Exceptional 10.5% |
| Immigrants | Lithuania | 98.9 /100 | #73 | Exceptional 10.5% |
| Immigrants | Lebanon | 98.8 /100 | #74 | Exceptional 10.5% |
| Sierra Leoneans | 98.7 /100 | #75 | Exceptional 10.5% |
| Immigrants | Sierra Leone | 98.7 /100 | #76 | Exceptional 10.5% |
| Laotians | 98.6 /100 | #77 | Exceptional 10.6% |
| Immigrants | Russia | 98.6 /100 | #78 | Exceptional 10.6% |
| Zimbabweans | 98.4 /100 | #79 | Exceptional 10.6% |
| Immigrants | Jordan | 98.4 /100 | #80 | Exceptional 10.6% |
Demographics Similar to Basques by Male Disability
In terms of male disability, the demographic groups most similar to Basques are Belgian (12.1%, a difference of 0.040%), Swedish (12.1%, a difference of 0.12%), Swiss (12.1%, a difference of 0.19%), European (12.1%, a difference of 0.19%), and Chinese (12.1%, a difference of 0.44%).
| Demographics | Rating | Rank | Male Disability |
| German Russians | 0.5 /100 | #251 | Tragic 12.0% |
| Slovenes | 0.5 /100 | #252 | Tragic 12.0% |
| Guamanians/Chamorros | 0.5 /100 | #253 | Tragic 12.0% |
| British | 0.4 /100 | #254 | Tragic 12.1% |
| Chinese | 0.4 /100 | #255 | Tragic 12.1% |
| Swiss | 0.3 /100 | #256 | Tragic 12.1% |
| Europeans | 0.3 /100 | #257 | Tragic 12.1% |
| Basques | 0.3 /100 | #258 | Tragic 12.1% |
| Belgians | 0.3 /100 | #259 | Tragic 12.1% |
| Swedes | 0.3 /100 | #260 | Tragic 12.1% |
| Slavs | 0.2 /100 | #261 | Tragic 12.2% |
| Norwegians | 0.2 /100 | #262 | Tragic 12.2% |
| Canadians | 0.2 /100 | #263 | Tragic 12.2% |
| Nepalese | 0.2 /100 | #264 | Tragic 12.2% |
| Immigrants | Portugal | 0.1 /100 | #265 | Tragic 12.3% |