Carpatho Rusyn vs Canadian In Labor Force | Age 20-24
COMPARE
Carpatho Rusyn
Canadian
In Labor Force | Age 20-24
In Labor Force | Age 20-24 Comparison
Carpatho Rusyns
Canadians
76.5%
IN LABOR FORCE | AGE 20-24
99.4/ 100
METRIC RATING
83rd/ 347
METRIC RANK
76.6%
IN LABOR FORCE | AGE 20-24
99.6/ 100
METRIC RATING
78th/ 347
METRIC RANK
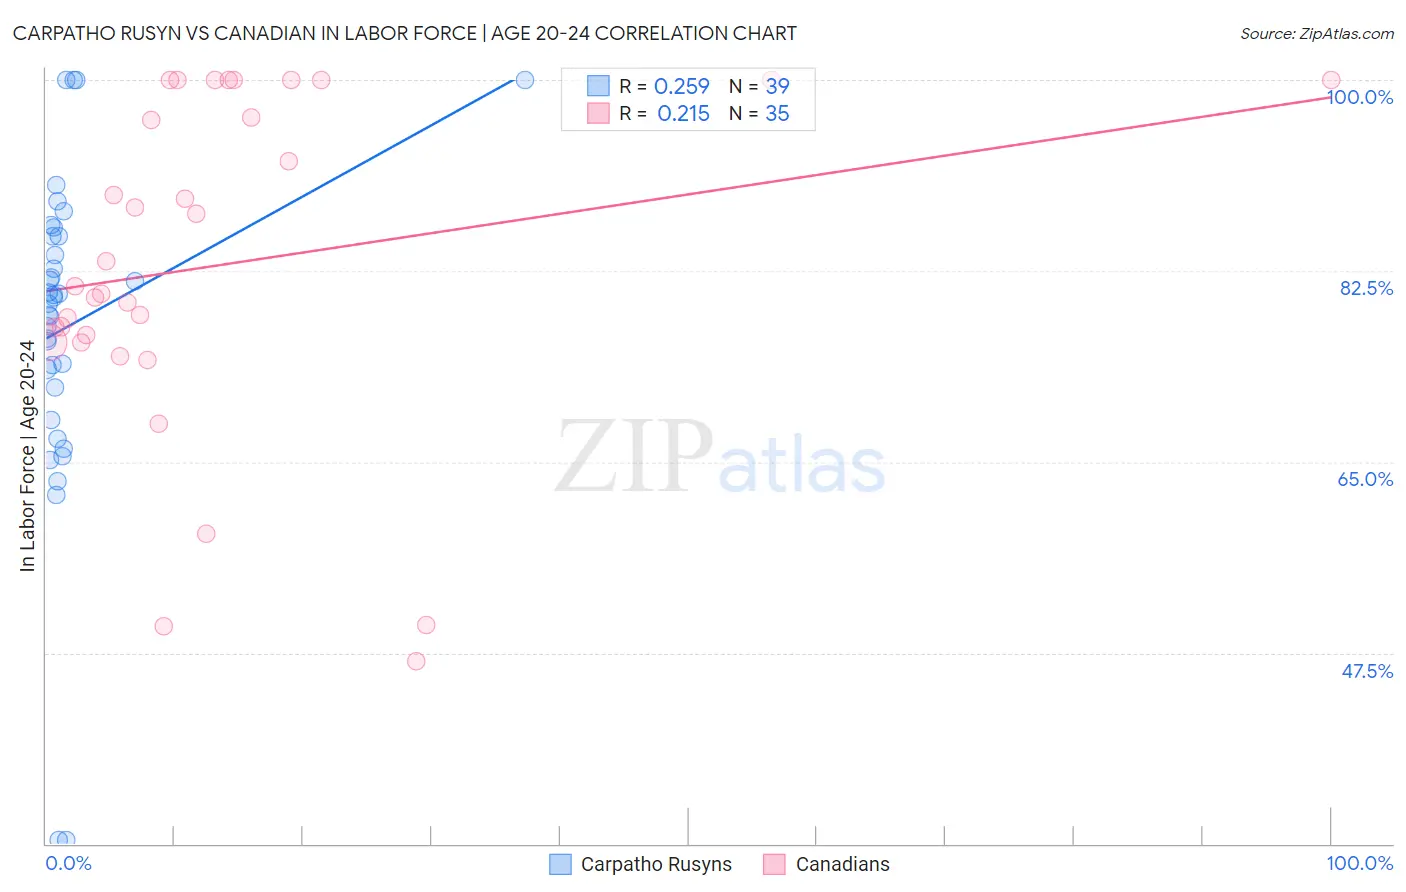
Carpatho Rusyn vs Canadian In Labor Force | Age 20-24 Correlation Chart
The statistical analysis conducted on geographies consisting of 58,856,005 people shows a weak positive correlation between the proportion of Carpatho Rusyns and labor force participation rate among population between the ages 20 and 24 in the United States with a correlation coefficient (R) of 0.259 and weighted average of 76.5%. Similarly, the statistical analysis conducted on geographies consisting of 437,221,793 people shows a weak positive correlation between the proportion of Canadians and labor force participation rate among population between the ages 20 and 24 in the United States with a correlation coefficient (R) of 0.215 and weighted average of 76.6%, a difference of 0.15%.
In Labor Force | Age 20-24 Correlation Summary
| Measurement | Carpatho Rusyn | Canadian |
| Minimum | 30.4% | 46.7% |
| Maximum | 100.0% | 100.0% |
| Range | 69.6% | 53.3% |
| Mean | 77.5% | 83.1% |
| Median | 80.0% | 81.1% |
| Interquartile 25% (IQ1) | 71.9% | 76.0% |
| Interquartile 75% (IQ3) | 85.7% | 100.0% |
| Interquartile Range (IQR) | 13.8% | 24.0% |
| Standard Deviation (Sample) | 14.9% | 15.3% |
| Standard Deviation (Population) | 14.7% | 15.0% |
Demographics Similar to Carpatho Rusyns and Canadians by In Labor Force | Age 20-24
In terms of in labor force | age 20-24, the demographic groups most similar to Carpatho Rusyns are Austrian (76.5%, a difference of 0.010%), Portuguese (76.4%, a difference of 0.040%), Immigrants from Iraq (76.4%, a difference of 0.060%), Immigrants from Thailand (76.4%, a difference of 0.060%), and Basque (76.5%, a difference of 0.090%). Similarly, the demographic groups most similar to Canadians are Immigrants from Cameroon (76.6%, a difference of 0.0%), Immigrants from Zaire (76.6%, a difference of 0.020%), Immigrants from Moldova (76.6%, a difference of 0.040%), Italian (76.5%, a difference of 0.050%), and Basque (76.5%, a difference of 0.060%).
| Demographics | Rating | Rank | In Labor Force | Age 20-24 |
| Ottawa | 99.8 /100 | #70 | Exceptional 76.8% |
| Northern Europeans | 99.8 /100 | #71 | Exceptional 76.8% |
| Guamanians/Chamorros | 99.8 /100 | #72 | Exceptional 76.7% |
| British | 99.8 /100 | #73 | Exceptional 76.7% |
| Cree | 99.7 /100 | #74 | Exceptional 76.6% |
| Immigrants | Middle Africa | 99.7 /100 | #75 | Exceptional 76.6% |
| Immigrants | Moldova | 99.6 /100 | #76 | Exceptional 76.6% |
| Immigrants | Cameroon | 99.6 /100 | #77 | Exceptional 76.6% |
| Canadians | 99.6 /100 | #78 | Exceptional 76.6% |
| Immigrants | Zaire | 99.6 /100 | #79 | Exceptional 76.6% |
| Italians | 99.6 /100 | #80 | Exceptional 76.5% |
| Basques | 99.5 /100 | #81 | Exceptional 76.5% |
| Hmong | 99.5 /100 | #82 | Exceptional 76.5% |
| Carpatho Rusyns | 99.4 /100 | #83 | Exceptional 76.5% |
| Austrians | 99.4 /100 | #84 | Exceptional 76.5% |
| Portuguese | 99.3 /100 | #85 | Exceptional 76.4% |
| Immigrants | Iraq | 99.3 /100 | #86 | Exceptional 76.4% |
| Immigrants | Thailand | 99.3 /100 | #87 | Exceptional 76.4% |
| Spanish | 99.2 /100 | #88 | Exceptional 76.4% |
| Bulgarians | 99.2 /100 | #89 | Exceptional 76.4% |
| Immigrants | Burma/Myanmar | 99.1 /100 | #90 | Exceptional 76.3% |