Cape Verdean vs Aleut Vision Disability
COMPARE
Cape Verdean
Aleut
Vision Disability
Vision Disability Comparison
Cape Verdeans
Aleuts
2.4%
VISION DISABILITY
0.0/ 100
METRIC RATING
280th/ 347
METRIC RANK
2.6%
VISION DISABILITY
0.0/ 100
METRIC RATING
304th/ 347
METRIC RANK
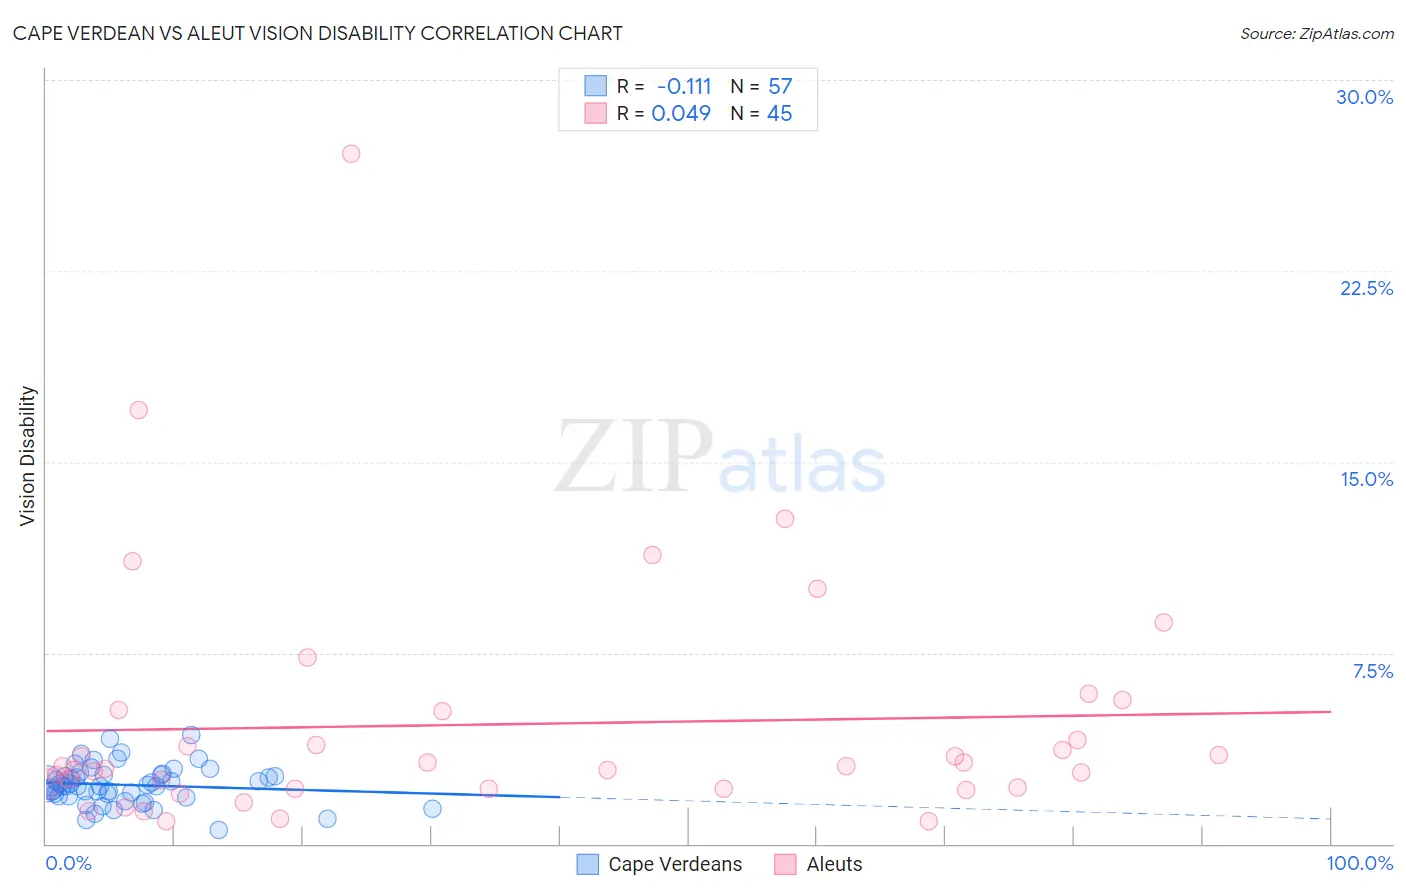
Cape Verdean vs Aleut Vision Disability Correlation Chart
The statistical analysis conducted on geographies consisting of 107,539,896 people shows a poor negative correlation between the proportion of Cape Verdeans and percentage of population with vision disability in the United States with a correlation coefficient (R) of -0.111 and weighted average of 2.4%. Similarly, the statistical analysis conducted on geographies consisting of 61,773,801 people shows no correlation between the proportion of Aleuts and percentage of population with vision disability in the United States with a correlation coefficient (R) of 0.049 and weighted average of 2.6%, a difference of 5.7%.
Vision Disability Correlation Summary
| Measurement | Cape Verdean | Aleut |
| Minimum | 0.56% | 0.87% |
| Maximum | 4.3% | 27.1% |
| Range | 3.7% | 26.2% |
| Mean | 2.3% | 4.7% |
| Median | 2.3% | 3.0% |
| Interquartile 25% (IQ1) | 1.9% | 2.2% |
| Interquartile 75% (IQ3) | 2.7% | 5.2% |
| Interquartile Range (IQR) | 0.84% | 3.1% |
| Standard Deviation (Sample) | 0.75% | 4.9% |
| Standard Deviation (Population) | 0.74% | 4.8% |
Similar Demographics by Vision Disability
Demographics Similar to Cape Verdeans by Vision Disability
In terms of vision disability, the demographic groups most similar to Cape Verdeans are Nepalese (2.4%, a difference of 0.040%), Spanish (2.4%, a difference of 0.050%), Bahamian (2.4%, a difference of 0.21%), U.S. Virgin Islander (2.5%, a difference of 0.23%), and Scotch-Irish (2.4%, a difference of 0.25%).
| Demographics | Rating | Rank | Vision Disability |
| Immigrants | Bahamas | 0.1 /100 | #273 | Tragic 2.4% |
| Immigrants | Latin America | 0.0 /100 | #274 | Tragic 2.4% |
| Chippewa | 0.0 /100 | #275 | Tragic 2.4% |
| Scotch-Irish | 0.0 /100 | #276 | Tragic 2.4% |
| Bahamians | 0.0 /100 | #277 | Tragic 2.4% |
| Spanish | 0.0 /100 | #278 | Tragic 2.4% |
| Nepalese | 0.0 /100 | #279 | Tragic 2.4% |
| Cape Verdeans | 0.0 /100 | #280 | Tragic 2.4% |
| U.S. Virgin Islanders | 0.0 /100 | #281 | Tragic 2.5% |
| Immigrants | Caribbean | 0.0 /100 | #282 | Tragic 2.5% |
| Puget Sound Salish | 0.0 /100 | #283 | Tragic 2.5% |
| Yakama | 0.0 /100 | #284 | Tragic 2.5% |
| Immigrants | Central America | 0.0 /100 | #285 | Tragic 2.5% |
| Sioux | 0.0 /100 | #286 | Tragic 2.5% |
| Hondurans | 0.0 /100 | #287 | Tragic 2.5% |
Demographics Similar to Aleuts by Vision Disability
In terms of vision disability, the demographic groups most similar to Aleuts are Immigrants from Cabo Verde (2.6%, a difference of 0.13%), Hispanic or Latino (2.6%, a difference of 0.30%), Spanish American Indian (2.6%, a difference of 0.36%), Iroquois (2.6%, a difference of 0.91%), and Immigrants from Dominican Republic (2.6%, a difference of 0.94%).
| Demographics | Rating | Rank | Vision Disability |
| Immigrants | Dominica | 0.0 /100 | #297 | Tragic 2.5% |
| Mexicans | 0.0 /100 | #298 | Tragic 2.5% |
| Cree | 0.0 /100 | #299 | Tragic 2.5% |
| Africans | 0.0 /100 | #300 | Tragic 2.5% |
| Menominee | 0.0 /100 | #301 | Tragic 2.5% |
| Spanish American Indians | 0.0 /100 | #302 | Tragic 2.6% |
| Immigrants | Cabo Verde | 0.0 /100 | #303 | Tragic 2.6% |
| Aleuts | 0.0 /100 | #304 | Tragic 2.6% |
| Hispanics or Latinos | 0.0 /100 | #305 | Tragic 2.6% |
| Iroquois | 0.0 /100 | #306 | Tragic 2.6% |
| Immigrants | Dominican Republic | 0.0 /100 | #307 | Tragic 2.6% |
| Arapaho | 0.0 /100 | #308 | Tragic 2.6% |
| Immigrants | Yemen | 0.0 /100 | #309 | Tragic 2.6% |
| Blackfeet | 0.0 /100 | #310 | Tragic 2.6% |
| Dominicans | 0.0 /100 | #311 | Tragic 2.6% |