Cape Verdean vs Immigrants from Guyana Vision Disability
COMPARE
Cape Verdean
Immigrants from Guyana
Vision Disability
Vision Disability Comparison
Cape Verdeans
Immigrants from Guyana
2.4%
VISION DISABILITY
0.0/ 100
METRIC RATING
280th/ 347
METRIC RANK
2.2%
VISION DISABILITY
15.9/ 100
METRIC RATING
204th/ 347
METRIC RANK
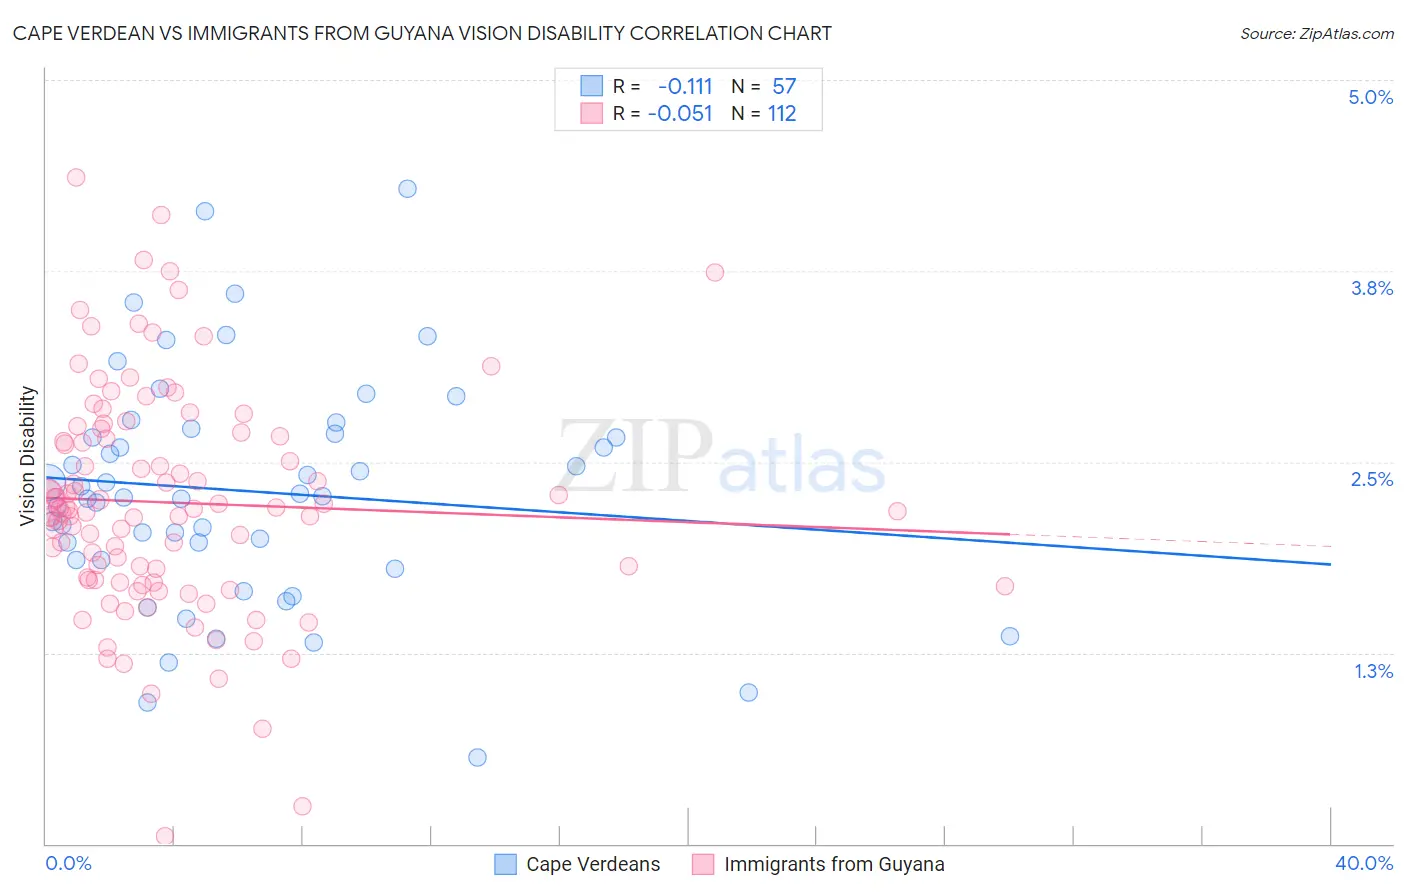
Cape Verdean vs Immigrants from Guyana Vision Disability Correlation Chart
The statistical analysis conducted on geographies consisting of 107,539,896 people shows a poor negative correlation between the proportion of Cape Verdeans and percentage of population with vision disability in the United States with a correlation coefficient (R) of -0.111 and weighted average of 2.4%. Similarly, the statistical analysis conducted on geographies consisting of 183,609,151 people shows a slight negative correlation between the proportion of Immigrants from Guyana and percentage of population with vision disability in the United States with a correlation coefficient (R) of -0.051 and weighted average of 2.2%, a difference of 10.0%.
Vision Disability Correlation Summary
| Measurement | Cape Verdean | Immigrants from Guyana |
| Minimum | 0.56% | 0.051% |
| Maximum | 4.3% | 4.4% |
| Range | 3.7% | 4.3% |
| Mean | 2.3% | 2.2% |
| Median | 2.3% | 2.2% |
| Interquartile 25% (IQ1) | 1.9% | 1.7% |
| Interquartile 75% (IQ3) | 2.7% | 2.7% |
| Interquartile Range (IQR) | 0.84% | 0.95% |
| Standard Deviation (Sample) | 0.75% | 0.74% |
| Standard Deviation (Population) | 0.74% | 0.74% |
Similar Demographics by Vision Disability
Demographics Similar to Cape Verdeans by Vision Disability
In terms of vision disability, the demographic groups most similar to Cape Verdeans are Nepalese (2.4%, a difference of 0.040%), Spanish (2.4%, a difference of 0.050%), Bahamian (2.4%, a difference of 0.21%), U.S. Virgin Islander (2.5%, a difference of 0.23%), and Scotch-Irish (2.4%, a difference of 0.25%).
| Demographics | Rating | Rank | Vision Disability |
| Immigrants | Bahamas | 0.1 /100 | #273 | Tragic 2.4% |
| Immigrants | Latin America | 0.0 /100 | #274 | Tragic 2.4% |
| Chippewa | 0.0 /100 | #275 | Tragic 2.4% |
| Scotch-Irish | 0.0 /100 | #276 | Tragic 2.4% |
| Bahamians | 0.0 /100 | #277 | Tragic 2.4% |
| Spanish | 0.0 /100 | #278 | Tragic 2.4% |
| Nepalese | 0.0 /100 | #279 | Tragic 2.4% |
| Cape Verdeans | 0.0 /100 | #280 | Tragic 2.4% |
| U.S. Virgin Islanders | 0.0 /100 | #281 | Tragic 2.5% |
| Immigrants | Caribbean | 0.0 /100 | #282 | Tragic 2.5% |
| Puget Sound Salish | 0.0 /100 | #283 | Tragic 2.5% |
| Yakama | 0.0 /100 | #284 | Tragic 2.5% |
| Immigrants | Central America | 0.0 /100 | #285 | Tragic 2.5% |
| Sioux | 0.0 /100 | #286 | Tragic 2.5% |
| Hondurans | 0.0 /100 | #287 | Tragic 2.5% |
Demographics Similar to Immigrants from Guyana by Vision Disability
In terms of vision disability, the demographic groups most similar to Immigrants from Guyana are Samoan (2.2%, a difference of 0.030%), Dutch (2.2%, a difference of 0.13%), Pennsylvania German (2.2%, a difference of 0.17%), Immigrants from Zaire (2.2%, a difference of 0.23%), and Immigrants from Nigeria (2.2%, a difference of 0.30%).
| Demographics | Rating | Rank | Vision Disability |
| Ghanaians | 21.8 /100 | #197 | Fair 2.2% |
| Czechoslovakians | 21.6 /100 | #198 | Fair 2.2% |
| Immigrants | El Salvador | 21.0 /100 | #199 | Fair 2.2% |
| Immigrants | Thailand | 20.1 /100 | #200 | Fair 2.2% |
| Slovaks | 18.8 /100 | #201 | Poor 2.2% |
| Immigrants | Zaire | 18.0 /100 | #202 | Poor 2.2% |
| Dutch | 17.1 /100 | #203 | Poor 2.2% |
| Immigrants | Guyana | 15.9 /100 | #204 | Poor 2.2% |
| Samoans | 15.7 /100 | #205 | Poor 2.2% |
| Pennsylvania Germans | 14.5 /100 | #206 | Poor 2.2% |
| Immigrants | Nigeria | 13.5 /100 | #207 | Poor 2.2% |
| Germans | 13.4 /100 | #208 | Poor 2.2% |
| Immigrants | Brazil | 13.1 /100 | #209 | Poor 2.2% |
| Immigrants | Uruguay | 11.5 /100 | #210 | Poor 2.2% |
| Indonesians | 9.5 /100 | #211 | Tragic 2.2% |