Immigrants from Panama vs Inupiat Ambulatory Disability
COMPARE
Immigrants from Panama
Inupiat
Ambulatory Disability
Ambulatory Disability Comparison
Immigrants from Panama
Inupiat
6.5%
AMBULATORY DISABILITY
1.5/ 100
METRIC RATING
244th/ 347
METRIC RANK
5.6%
AMBULATORY DISABILITY
99.8/ 100
METRIC RATING
56th/ 347
METRIC RANK
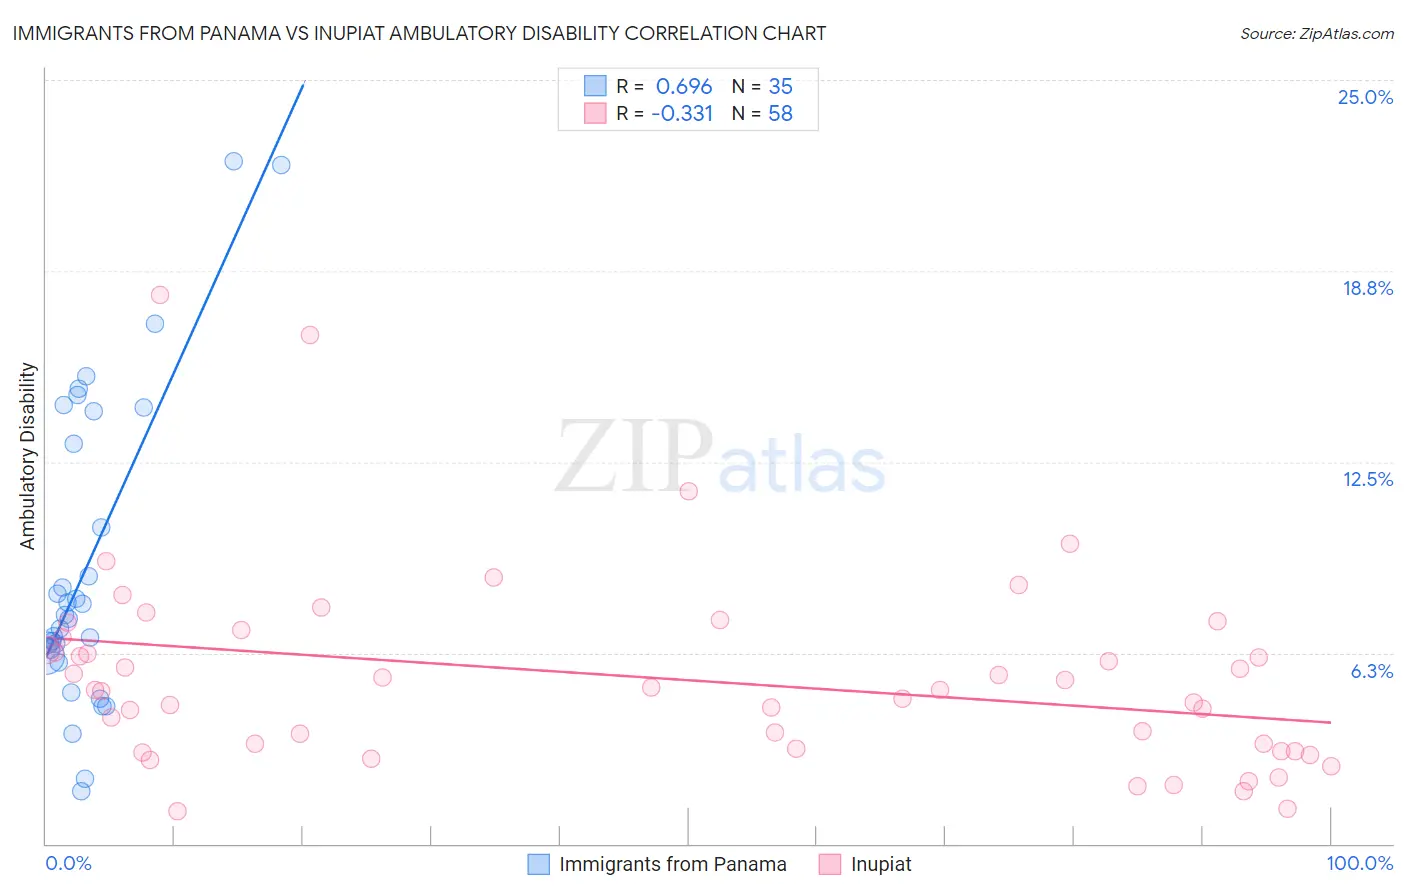
Immigrants from Panama vs Inupiat Ambulatory Disability Correlation Chart
The statistical analysis conducted on geographies consisting of 221,176,077 people shows a significant positive correlation between the proportion of Immigrants from Panama and percentage of population with ambulatory disability in the United States with a correlation coefficient (R) of 0.696 and weighted average of 6.5%. Similarly, the statistical analysis conducted on geographies consisting of 96,327,130 people shows a mild negative correlation between the proportion of Inupiat and percentage of population with ambulatory disability in the United States with a correlation coefficient (R) of -0.331 and weighted average of 5.6%, a difference of 15.1%.
Ambulatory Disability Correlation Summary
| Measurement | Immigrants from Panama | Inupiat |
| Minimum | 1.7% | 1.1% |
| Maximum | 22.3% | 18.0% |
| Range | 20.6% | 16.9% |
| Mean | 9.2% | 5.4% |
| Median | 7.5% | 5.0% |
| Interquartile 25% (IQ1) | 6.1% | 3.1% |
| Interquartile 75% (IQ3) | 14.2% | 6.8% |
| Interquartile Range (IQR) | 8.0% | 3.7% |
| Standard Deviation (Sample) | 5.1% | 3.2% |
| Standard Deviation (Population) | 5.1% | 3.2% |
Similar Demographics by Ambulatory Disability
Demographics Similar to Immigrants from Panama by Ambulatory Disability
In terms of ambulatory disability, the demographic groups most similar to Immigrants from Panama are German (6.5%, a difference of 0.0%), Spaniard (6.5%, a difference of 0.020%), Tlingit-Haida (6.5%, a difference of 0.030%), Immigrants from Haiti (6.5%, a difference of 0.050%), and Armenian (6.5%, a difference of 0.050%).
| Demographics | Rating | Rank | Ambulatory Disability |
| Immigrants | Germany | 1.8 /100 | #237 | Tragic 6.4% |
| Haitians | 1.8 /100 | #238 | Tragic 6.4% |
| Senegalese | 1.7 /100 | #239 | Tragic 6.4% |
| Immigrants | Senegal | 1.7 /100 | #240 | Tragic 6.4% |
| Immigrants | Haiti | 1.6 /100 | #241 | Tragic 6.5% |
| Spaniards | 1.6 /100 | #242 | Tragic 6.5% |
| Germans | 1.5 /100 | #243 | Tragic 6.5% |
| Immigrants | Panama | 1.5 /100 | #244 | Tragic 6.5% |
| Tlingit-Haida | 1.5 /100 | #245 | Tragic 6.5% |
| Armenians | 1.5 /100 | #246 | Tragic 6.5% |
| Immigrants | Cuba | 1.4 /100 | #247 | Tragic 6.5% |
| Immigrants | Portugal | 1.4 /100 | #248 | Tragic 6.5% |
| Native Hawaiians | 1.1 /100 | #249 | Tragic 6.5% |
| Chinese | 1.0 /100 | #250 | Tragic 6.5% |
| Hawaiians | 0.9 /100 | #251 | Tragic 6.5% |
Demographics Similar to Inupiat by Ambulatory Disability
In terms of ambulatory disability, the demographic groups most similar to Inupiat are Immigrants from Bulgaria (5.6%, a difference of 0.090%), Immigrants from Eastern Africa (5.6%, a difference of 0.16%), Immigrants from Egypt (5.6%, a difference of 0.20%), Jordanian (5.6%, a difference of 0.21%), and Immigrants from Brazil (5.6%, a difference of 0.24%).
| Demographics | Rating | Rank | Ambulatory Disability |
| Bulgarians | 99.9 /100 | #49 | Exceptional 5.6% |
| Luxembourgers | 99.9 /100 | #50 | Exceptional 5.6% |
| Taiwanese | 99.8 /100 | #51 | Exceptional 5.6% |
| Jordanians | 99.8 /100 | #52 | Exceptional 5.6% |
| Immigrants | Egypt | 99.8 /100 | #53 | Exceptional 5.6% |
| Immigrants | Eastern Africa | 99.8 /100 | #54 | Exceptional 5.6% |
| Immigrants | Bulgaria | 99.8 /100 | #55 | Exceptional 5.6% |
| Inupiat | 99.8 /100 | #56 | Exceptional 5.6% |
| Immigrants | Brazil | 99.8 /100 | #57 | Exceptional 5.6% |
| Immigrants | Zimbabwe | 99.8 /100 | #58 | Exceptional 5.6% |
| Immigrants | Afghanistan | 99.8 /100 | #59 | Exceptional 5.6% |
| Immigrants | Lithuania | 99.8 /100 | #60 | Exceptional 5.6% |
| Immigrants | Belgium | 99.7 /100 | #61 | Exceptional 5.6% |
| Immigrants | Spain | 99.7 /100 | #62 | Exceptional 5.6% |
| Immigrants | France | 99.7 /100 | #63 | Exceptional 5.6% |