Cajun vs Cherokee Unemployment Among Ages 60 to 64 years
COMPARE
Cajun
Cherokee
Unemployment Among Ages 60 to 64 years
Unemployment Among Ages 60 to 64 years Comparison
Cajuns
Cherokee
4.9%
UNEMPLOYMENT AMONG AGES 60 TO 64 YEARS
12.3/ 100
METRIC RATING
216th/ 347
METRIC RANK
4.9%
UNEMPLOYMENT AMONG AGES 60 TO 64 YEARS
16.1/ 100
METRIC RATING
210th/ 347
METRIC RANK
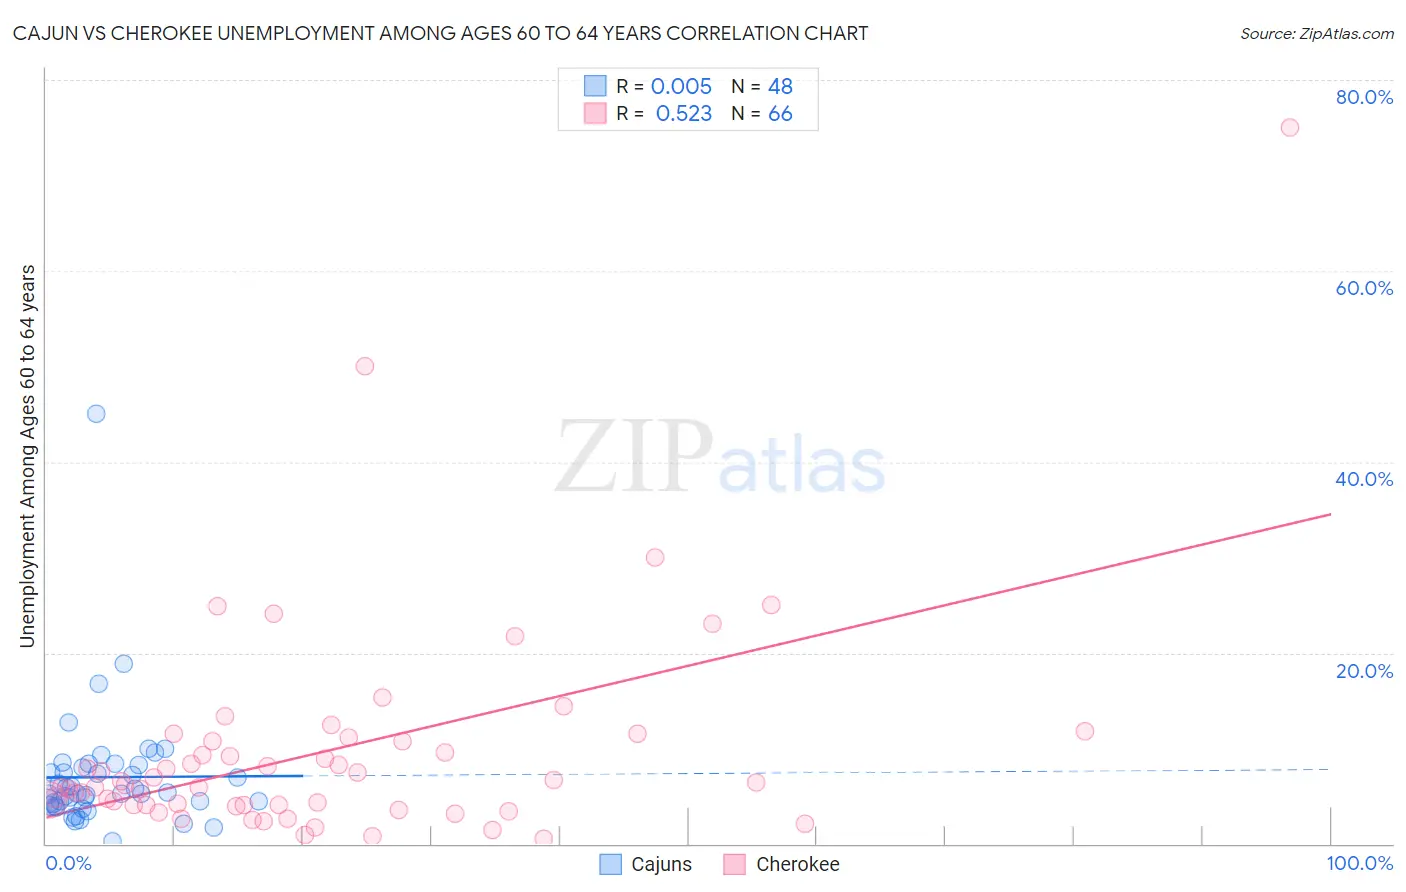
Cajun vs Cherokee Unemployment Among Ages 60 to 64 years Correlation Chart
The statistical analysis conducted on geographies consisting of 139,908,047 people shows no correlation between the proportion of Cajuns and unemployment rate among population between the ages 60 and 64 in the United States with a correlation coefficient (R) of 0.005 and weighted average of 4.9%. Similarly, the statistical analysis conducted on geographies consisting of 419,901,467 people shows a substantial positive correlation between the proportion of Cherokee and unemployment rate among population between the ages 60 and 64 in the United States with a correlation coefficient (R) of 0.523 and weighted average of 4.9%, a difference of 0.27%.
Unemployment Among Ages 60 to 64 years Correlation Summary
| Measurement | Cajun | Cherokee |
| Minimum | 0.20% | 0.51% |
| Maximum | 45.0% | 75.0% |
| Range | 44.8% | 74.5% |
| Mean | 7.0% | 9.7% |
| Median | 5.2% | 6.3% |
| Interquartile 25% (IQ1) | 4.1% | 4.0% |
| Interquartile 75% (IQ3) | 8.1% | 10.8% |
| Interquartile Range (IQR) | 4.0% | 6.8% |
| Standard Deviation (Sample) | 6.6% | 11.6% |
| Standard Deviation (Population) | 6.5% | 11.5% |
Demographics Similar to Cajuns and Cherokee by Unemployment Among Ages 60 to 64 years
In terms of unemployment among ages 60 to 64 years, the demographic groups most similar to Cajuns are Korean (4.9%, a difference of 0.010%), Immigrants from Singapore (4.9%, a difference of 0.020%), Immigrants from Brazil (4.9%, a difference of 0.050%), Immigrants from South Eastern Asia (4.9%, a difference of 0.060%), and Ottawa (4.9%, a difference of 0.060%). Similarly, the demographic groups most similar to Cherokee are Sierra Leonean (4.9%, a difference of 0.030%), Blackfeet (4.9%, a difference of 0.030%), German Russian (4.9%, a difference of 0.040%), Chippewa (4.9%, a difference of 0.070%), and Moroccan (4.9%, a difference of 0.070%).
| Demographics | Rating | Rank | Unemployment Among Ages 60 to 64 years |
| Uruguayans | 19.9 /100 | #203 | Poor 4.9% |
| Russians | 18.9 /100 | #204 | Poor 4.9% |
| Immigrants | Indonesia | 17.4 /100 | #205 | Poor 4.9% |
| New Zealanders | 17.4 /100 | #206 | Poor 4.9% |
| Chippewa | 17.3 /100 | #207 | Poor 4.9% |
| German Russians | 16.8 /100 | #208 | Poor 4.9% |
| Sierra Leoneans | 16.5 /100 | #209 | Poor 4.9% |
| Cherokee | 16.1 /100 | #210 | Poor 4.9% |
| Blackfeet | 15.7 /100 | #211 | Poor 4.9% |
| Moroccans | 15.0 /100 | #212 | Poor 4.9% |
| Eastern Europeans | 14.3 /100 | #213 | Poor 4.9% |
| Immigrants | Russia | 13.7 /100 | #214 | Poor 4.9% |
| Immigrants | South Eastern Asia | 13.1 /100 | #215 | Poor 4.9% |
| Cajuns | 12.3 /100 | #216 | Poor 4.9% |
| Koreans | 12.2 /100 | #217 | Poor 4.9% |
| Immigrants | Singapore | 12.0 /100 | #218 | Poor 4.9% |
| Immigrants | Brazil | 11.7 /100 | #219 | Poor 4.9% |
| Ottawa | 11.6 /100 | #220 | Poor 4.9% |
| Ugandans | 10.5 /100 | #221 | Poor 4.9% |
| Brazilians | 10.1 /100 | #222 | Poor 5.0% |
| Crow | 9.7 /100 | #223 | Tragic 5.0% |