Austrian vs American Hearing Disability
COMPARE
Austrian
American
Hearing Disability
Hearing Disability Comparison
Austrians
Americans
3.4%
HEARING DISABILITY
0.6/ 100
METRIC RATING
248th/ 347
METRIC RANK
3.9%
HEARING DISABILITY
0.0/ 100
METRIC RATING
311th/ 347
METRIC RANK
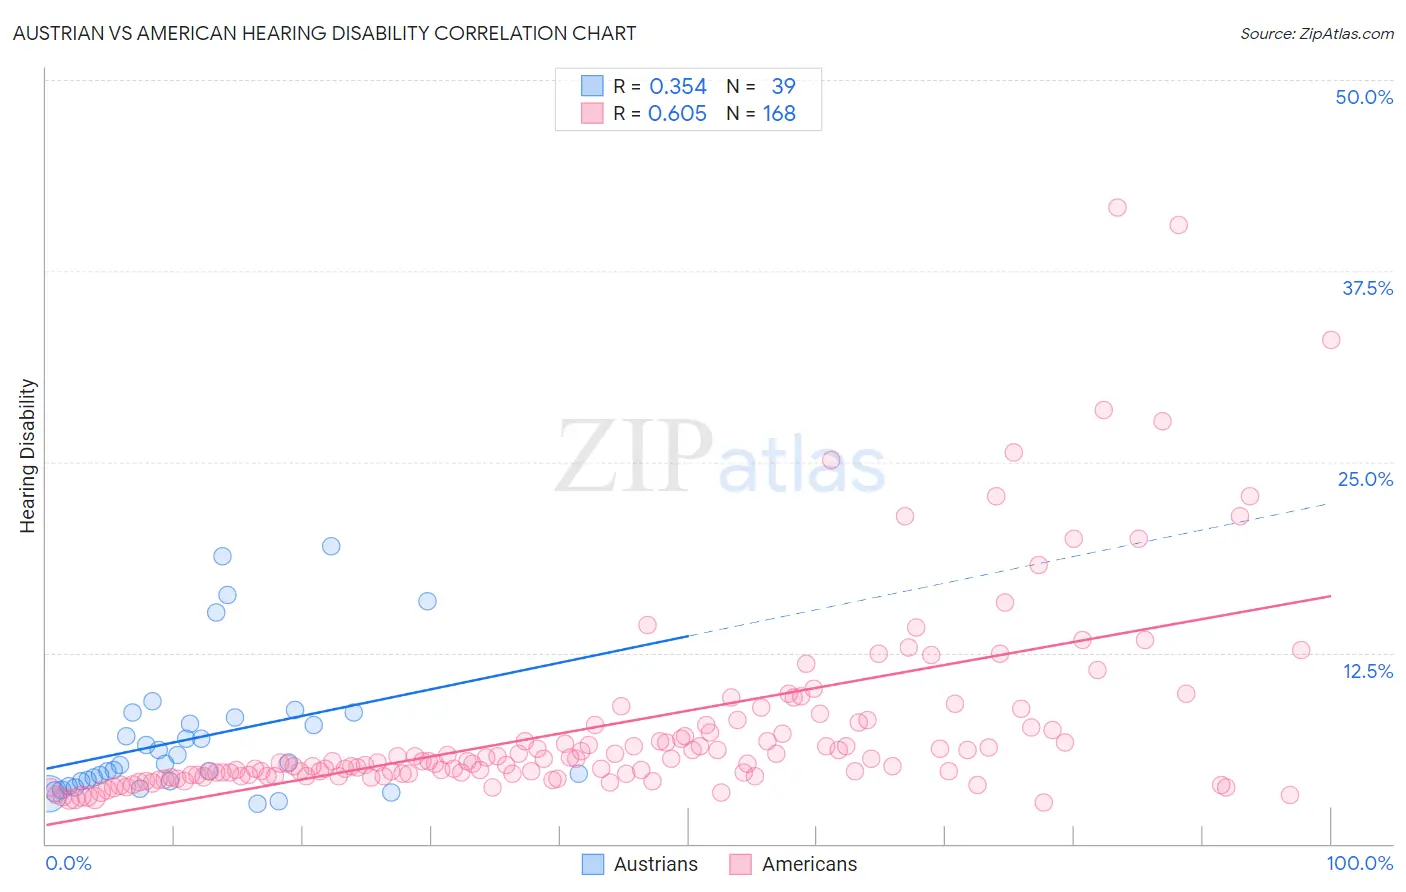
Austrian vs American Hearing Disability Correlation Chart
The statistical analysis conducted on geographies consisting of 451,912,592 people shows a mild positive correlation between the proportion of Austrians and percentage of population with hearing disability in the United States with a correlation coefficient (R) of 0.354 and weighted average of 3.4%. Similarly, the statistical analysis conducted on geographies consisting of 581,034,081 people shows a significant positive correlation between the proportion of Americans and percentage of population with hearing disability in the United States with a correlation coefficient (R) of 0.605 and weighted average of 3.9%, a difference of 16.0%.
Hearing Disability Correlation Summary
| Measurement | Austrian | American |
| Minimum | 2.6% | 2.7% |
| Maximum | 19.4% | 41.7% |
| Range | 16.9% | 38.9% |
| Mean | 6.9% | 7.7% |
| Median | 5.2% | 5.4% |
| Interquartile 25% (IQ1) | 4.1% | 4.5% |
| Interquartile 75% (IQ3) | 8.2% | 7.7% |
| Interquartile Range (IQR) | 4.2% | 3.2% |
| Standard Deviation (Sample) | 4.4% | 6.5% |
| Standard Deviation (Population) | 4.3% | 6.5% |
Similar Demographics by Hearing Disability
Demographics Similar to Austrians by Hearing Disability
In terms of hearing disability, the demographic groups most similar to Austrians are Lithuanian (3.4%, a difference of 0.22%), Immigrants from England (3.3%, a difference of 0.42%), Italian (3.4%, a difference of 0.53%), Yuman (3.4%, a difference of 0.54%), and Immigrants from Scotland (3.3%, a difference of 0.71%).
| Demographics | Rating | Rank | Hearing Disability |
| Samoans | 1.1 /100 | #241 | Tragic 3.3% |
| Yugoslavians | 1.0 /100 | #242 | Tragic 3.3% |
| Immigrants | Western Europe | 1.0 /100 | #243 | Tragic 3.3% |
| Assyrians/Chaldeans/Syriacs | 0.9 /100 | #244 | Tragic 3.3% |
| Immigrants | Scotland | 0.8 /100 | #245 | Tragic 3.3% |
| Immigrants | England | 0.7 /100 | #246 | Tragic 3.3% |
| Lithuanians | 0.6 /100 | #247 | Tragic 3.4% |
| Austrians | 0.6 /100 | #248 | Tragic 3.4% |
| Italians | 0.4 /100 | #249 | Tragic 3.4% |
| Yuman | 0.4 /100 | #250 | Tragic 3.4% |
| Hungarians | 0.4 /100 | #251 | Tragic 3.4% |
| Croatians | 0.4 /100 | #252 | Tragic 3.4% |
| Carpatho Rusyns | 0.3 /100 | #253 | Tragic 3.4% |
| Slavs | 0.2 /100 | #254 | Tragic 3.4% |
| Poles | 0.2 /100 | #255 | Tragic 3.4% |
Demographics Similar to Americans by Hearing Disability
In terms of hearing disability, the demographic groups most similar to Americans are Cajun (3.9%, a difference of 1.1%), Hopi (3.9%, a difference of 1.2%), Cree (3.8%, a difference of 1.3%), Yakama (3.9%, a difference of 1.4%), and Puget Sound Salish (3.9%, a difference of 1.4%).
| Demographics | Rating | Rank | Hearing Disability |
| French | 0.0 /100 | #304 | Tragic 3.8% |
| English | 0.0 /100 | #305 | Tragic 3.8% |
| Marshallese | 0.0 /100 | #306 | Tragic 3.8% |
| French Canadians | 0.0 /100 | #307 | Tragic 3.8% |
| Ottawa | 0.0 /100 | #308 | Tragic 3.8% |
| Scotch-Irish | 0.0 /100 | #309 | Tragic 3.8% |
| Cree | 0.0 /100 | #310 | Tragic 3.8% |
| Americans | 0.0 /100 | #311 | Tragic 3.9% |
| Cajuns | 0.0 /100 | #312 | Tragic 3.9% |
| Hopi | 0.0 /100 | #313 | Tragic 3.9% |
| Yakama | 0.0 /100 | #314 | Tragic 3.9% |
| Puget Sound Salish | 0.0 /100 | #315 | Tragic 3.9% |
| Spanish Americans | 0.0 /100 | #316 | Tragic 4.0% |
| Comanche | 0.0 /100 | #317 | Tragic 4.0% |
| Cheyenne | 0.0 /100 | #318 | Tragic 4.0% |