Immigrants from Saudi Arabia vs American Hearing Disability
COMPARE
Immigrants from Saudi Arabia
American
Hearing Disability
Hearing Disability Comparison
Immigrants from Saudi Arabia
Americans
2.7%
HEARING DISABILITY
97.5/ 100
METRIC RATING
75th/ 347
METRIC RANK
3.9%
HEARING DISABILITY
0.0/ 100
METRIC RATING
311th/ 347
METRIC RANK
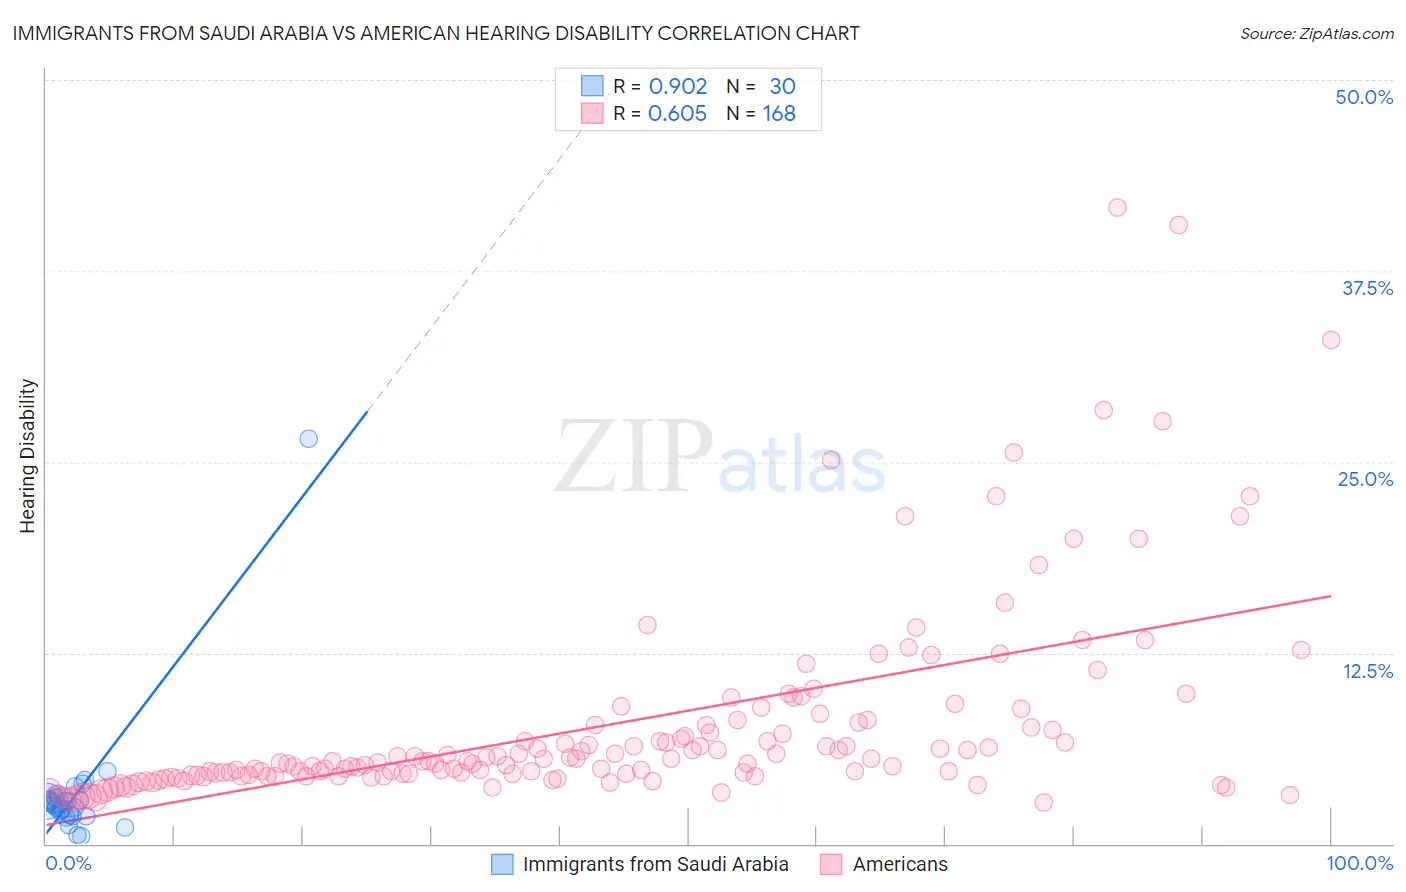
Immigrants from Saudi Arabia vs American Hearing Disability Correlation Chart
The statistical analysis conducted on geographies consisting of 164,279,608 people shows a near-perfect positive correlation between the proportion of Immigrants from Saudi Arabia and percentage of population with hearing disability in the United States with a correlation coefficient (R) of 0.902 and weighted average of 2.7%. Similarly, the statistical analysis conducted on geographies consisting of 581,034,081 people shows a significant positive correlation between the proportion of Americans and percentage of population with hearing disability in the United States with a correlation coefficient (R) of 0.605 and weighted average of 3.9%, a difference of 42.3%.
Hearing Disability Correlation Summary
| Measurement | Immigrants from Saudi Arabia | American |
| Minimum | 0.52% | 2.7% |
| Maximum | 26.5% | 41.7% |
| Range | 26.0% | 38.9% |
| Mean | 3.3% | 7.7% |
| Median | 2.7% | 5.4% |
| Interquartile 25% (IQ1) | 1.9% | 4.5% |
| Interquartile 75% (IQ3) | 3.0% | 7.7% |
| Interquartile Range (IQR) | 1.1% | 3.2% |
| Standard Deviation (Sample) | 4.5% | 6.5% |
| Standard Deviation (Population) | 4.4% | 6.5% |
Similar Demographics by Hearing Disability
Demographics Similar to Immigrants from Saudi Arabia by Hearing Disability
In terms of hearing disability, the demographic groups most similar to Immigrants from Saudi Arabia are Asian (2.7%, a difference of 0.0%), Argentinean (2.7%, a difference of 0.030%), Immigrants from Korea (2.7%, a difference of 0.030%), Immigrants from Malaysia (2.7%, a difference of 0.030%), and Mongolian (2.7%, a difference of 0.070%).
| Demographics | Rating | Rank | Hearing Disability |
| Immigrants | Africa | 98.0 /100 | #68 | Exceptional 2.7% |
| Nicaraguans | 97.9 /100 | #69 | Exceptional 2.7% |
| Peruvians | 97.7 /100 | #70 | Exceptional 2.7% |
| Central Americans | 97.7 /100 | #71 | Exceptional 2.7% |
| Afghans | 97.6 /100 | #72 | Exceptional 2.7% |
| Argentineans | 97.5 /100 | #73 | Exceptional 2.7% |
| Immigrants | Korea | 97.5 /100 | #74 | Exceptional 2.7% |
| Immigrants | Saudi Arabia | 97.5 /100 | #75 | Exceptional 2.7% |
| Asians | 97.5 /100 | #76 | Exceptional 2.7% |
| Immigrants | Malaysia | 97.5 /100 | #77 | Exceptional 2.7% |
| Mongolians | 97.4 /100 | #78 | Exceptional 2.7% |
| Colombians | 97.4 /100 | #79 | Exceptional 2.7% |
| Immigrants | Asia | 97.2 /100 | #80 | Exceptional 2.7% |
| Immigrants | Uruguay | 97.2 /100 | #81 | Exceptional 2.7% |
| Immigrants | Armenia | 97.2 /100 | #82 | Exceptional 2.7% |
Demographics Similar to Americans by Hearing Disability
In terms of hearing disability, the demographic groups most similar to Americans are Cajun (3.9%, a difference of 1.1%), Hopi (3.9%, a difference of 1.2%), Cree (3.8%, a difference of 1.3%), Yakama (3.9%, a difference of 1.4%), and Puget Sound Salish (3.9%, a difference of 1.4%).
| Demographics | Rating | Rank | Hearing Disability |
| French | 0.0 /100 | #304 | Tragic 3.8% |
| English | 0.0 /100 | #305 | Tragic 3.8% |
| Marshallese | 0.0 /100 | #306 | Tragic 3.8% |
| French Canadians | 0.0 /100 | #307 | Tragic 3.8% |
| Ottawa | 0.0 /100 | #308 | Tragic 3.8% |
| Scotch-Irish | 0.0 /100 | #309 | Tragic 3.8% |
| Cree | 0.0 /100 | #310 | Tragic 3.8% |
| Americans | 0.0 /100 | #311 | Tragic 3.9% |
| Cajuns | 0.0 /100 | #312 | Tragic 3.9% |
| Hopi | 0.0 /100 | #313 | Tragic 3.9% |
| Yakama | 0.0 /100 | #314 | Tragic 3.9% |
| Puget Sound Salish | 0.0 /100 | #315 | Tragic 3.9% |
| Spanish Americans | 0.0 /100 | #316 | Tragic 4.0% |
| Comanche | 0.0 /100 | #317 | Tragic 4.0% |
| Cheyenne | 0.0 /100 | #318 | Tragic 4.0% |