Bulgarian vs Immigrants from Belarus Ambulatory Disability
COMPARE
Bulgarian
Immigrants from Belarus
Ambulatory Disability
Ambulatory Disability Comparison
Bulgarians
Immigrants from Belarus
5.6%
AMBULATORY DISABILITY
99.9/ 100
METRIC RATING
49th/ 347
METRIC RANK
6.1%
AMBULATORY DISABILITY
69.2/ 100
METRIC RATING
161st/ 347
METRIC RANK
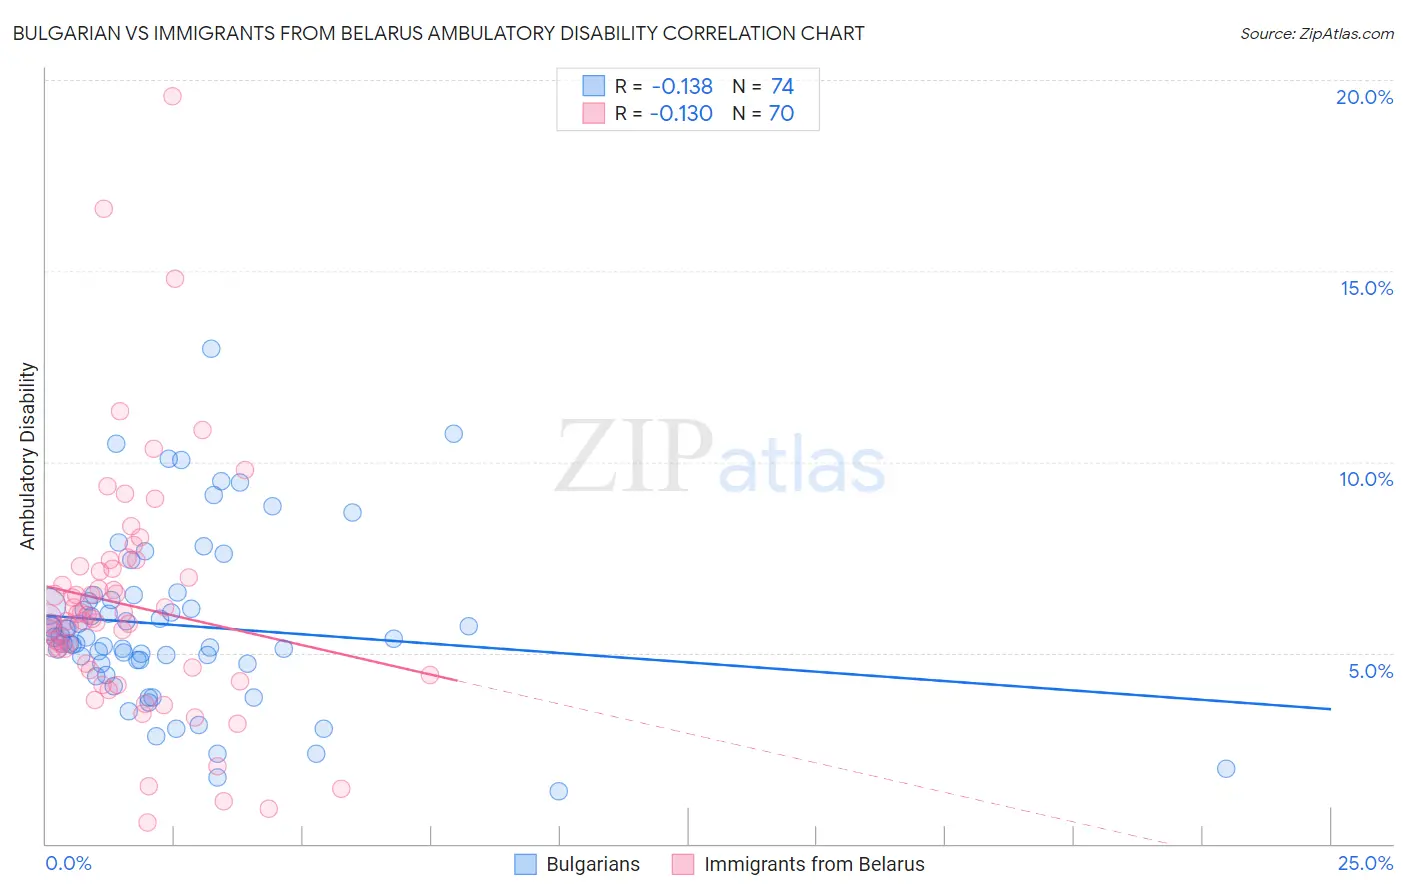
Bulgarian vs Immigrants from Belarus Ambulatory Disability Correlation Chart
The statistical analysis conducted on geographies consisting of 205,613,194 people shows a poor negative correlation between the proportion of Bulgarians and percentage of population with ambulatory disability in the United States with a correlation coefficient (R) of -0.138 and weighted average of 5.6%. Similarly, the statistical analysis conducted on geographies consisting of 150,188,321 people shows a poor negative correlation between the proportion of Immigrants from Belarus and percentage of population with ambulatory disability in the United States with a correlation coefficient (R) of -0.130 and weighted average of 6.1%, a difference of 8.7%.
Ambulatory Disability Correlation Summary
| Measurement | Bulgarian | Immigrants from Belarus |
| Minimum | 1.4% | 0.54% |
| Maximum | 12.9% | 19.6% |
| Range | 11.6% | 19.0% |
| Mean | 5.7% | 6.2% |
| Median | 5.4% | 5.9% |
| Interquartile 25% (IQ1) | 4.7% | 4.5% |
| Interquartile 75% (IQ3) | 6.4% | 7.2% |
| Interquartile Range (IQR) | 1.6% | 2.7% |
| Standard Deviation (Sample) | 2.2% | 3.2% |
| Standard Deviation (Population) | 2.2% | 3.2% |
Similar Demographics by Ambulatory Disability
Demographics Similar to Bulgarians by Ambulatory Disability
In terms of ambulatory disability, the demographic groups most similar to Bulgarians are Immigrants from Argentina (5.6%, a difference of 0.19%), Egyptian (5.6%, a difference of 0.21%), Immigrants from Japan (5.6%, a difference of 0.21%), Immigrants from Sweden (5.6%, a difference of 0.22%), and Luxembourger (5.6%, a difference of 0.34%).
| Demographics | Rating | Rank | Ambulatory Disability |
| Argentineans | 99.9 /100 | #42 | Exceptional 5.5% |
| Paraguayans | 99.9 /100 | #43 | Exceptional 5.5% |
| Immigrants | Indonesia | 99.9 /100 | #44 | Exceptional 5.5% |
| Immigrants | Sweden | 99.9 /100 | #45 | Exceptional 5.6% |
| Egyptians | 99.9 /100 | #46 | Exceptional 5.6% |
| Immigrants | Japan | 99.9 /100 | #47 | Exceptional 5.6% |
| Immigrants | Argentina | 99.9 /100 | #48 | Exceptional 5.6% |
| Bulgarians | 99.9 /100 | #49 | Exceptional 5.6% |
| Luxembourgers | 99.9 /100 | #50 | Exceptional 5.6% |
| Taiwanese | 99.8 /100 | #51 | Exceptional 5.6% |
| Jordanians | 99.8 /100 | #52 | Exceptional 5.6% |
| Immigrants | Egypt | 99.8 /100 | #53 | Exceptional 5.6% |
| Immigrants | Eastern Africa | 99.8 /100 | #54 | Exceptional 5.6% |
| Immigrants | Bulgaria | 99.8 /100 | #55 | Exceptional 5.6% |
| Inupiat | 99.8 /100 | #56 | Exceptional 5.6% |
Demographics Similar to Immigrants from Belarus by Ambulatory Disability
In terms of ambulatory disability, the demographic groups most similar to Immigrants from Belarus are Central American (6.0%, a difference of 0.040%), Immigrants from Latvia (6.0%, a difference of 0.12%), Immigrants from Fiji (6.0%, a difference of 0.13%), Nigerian (6.1%, a difference of 0.13%), and Ghanaian (6.0%, a difference of 0.14%).
| Demographics | Rating | Rank | Ambulatory Disability |
| Immigrants | Croatia | 75.1 /100 | #154 | Good 6.0% |
| Immigrants | Scotland | 72.1 /100 | #155 | Good 6.0% |
| Northern Europeans | 71.8 /100 | #156 | Good 6.0% |
| Ghanaians | 71.3 /100 | #157 | Good 6.0% |
| Immigrants | Fiji | 71.2 /100 | #158 | Good 6.0% |
| Immigrants | Latvia | 71.1 /100 | #159 | Good 6.0% |
| Central Americans | 69.8 /100 | #160 | Good 6.0% |
| Immigrants | Belarus | 69.2 /100 | #161 | Good 6.1% |
| Nigerians | 67.1 /100 | #162 | Good 6.1% |
| Lebanese | 66.2 /100 | #163 | Good 6.1% |
| Basques | 63.7 /100 | #164 | Good 6.1% |
| Nicaraguans | 63.2 /100 | #165 | Good 6.1% |
| Iraqis | 62.8 /100 | #166 | Good 6.1% |
| Immigrants | Oceania | 60.7 /100 | #167 | Good 6.1% |
| Ecuadorians | 60.5 /100 | #168 | Good 6.1% |