Bulgarian vs Immigrants from Cuba Ambulatory Disability
COMPARE
Bulgarian
Immigrants from Cuba
Ambulatory Disability
Ambulatory Disability Comparison
Bulgarians
Immigrants from Cuba
5.6%
AMBULATORY DISABILITY
99.9/ 100
METRIC RATING
49th/ 347
METRIC RANK
6.5%
AMBULATORY DISABILITY
1.4/ 100
METRIC RATING
247th/ 347
METRIC RANK
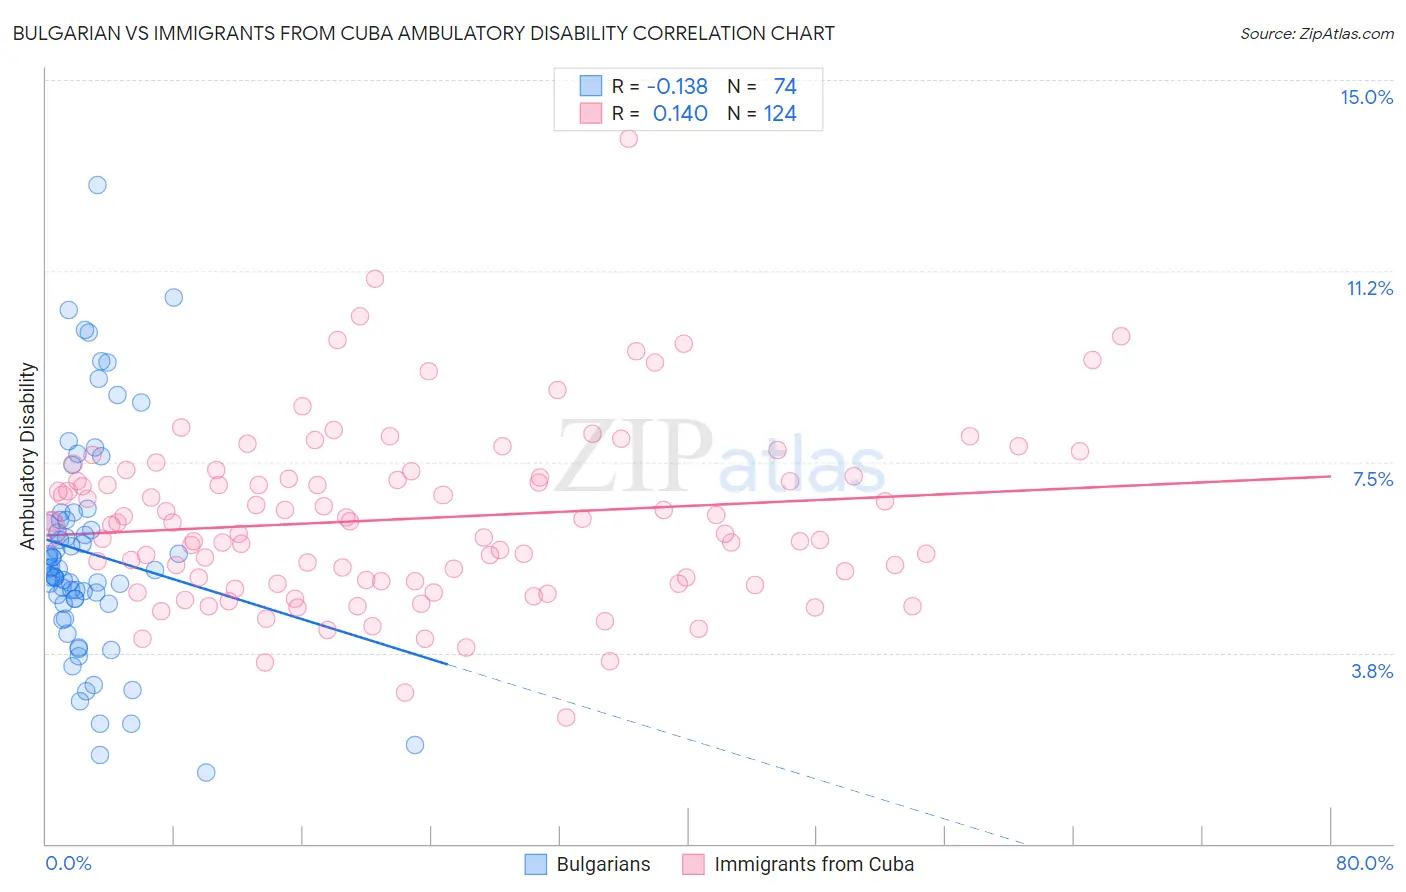
Bulgarian vs Immigrants from Cuba Ambulatory Disability Correlation Chart
The statistical analysis conducted on geographies consisting of 205,613,194 people shows a poor negative correlation between the proportion of Bulgarians and percentage of population with ambulatory disability in the United States with a correlation coefficient (R) of -0.138 and weighted average of 5.6%. Similarly, the statistical analysis conducted on geographies consisting of 325,985,542 people shows a poor positive correlation between the proportion of Immigrants from Cuba and percentage of population with ambulatory disability in the United States with a correlation coefficient (R) of 0.140 and weighted average of 6.5%, a difference of 16.1%.
Ambulatory Disability Correlation Summary
| Measurement | Bulgarian | Immigrants from Cuba |
| Minimum | 1.4% | 2.5% |
| Maximum | 12.9% | 13.8% |
| Range | 11.6% | 11.4% |
| Mean | 5.7% | 6.4% |
| Median | 5.4% | 6.3% |
| Interquartile 25% (IQ1) | 4.7% | 5.2% |
| Interquartile 75% (IQ3) | 6.4% | 7.2% |
| Interquartile Range (IQR) | 1.6% | 2.1% |
| Standard Deviation (Sample) | 2.2% | 1.7% |
| Standard Deviation (Population) | 2.2% | 1.7% |
Similar Demographics by Ambulatory Disability
Demographics Similar to Bulgarians by Ambulatory Disability
In terms of ambulatory disability, the demographic groups most similar to Bulgarians are Immigrants from Argentina (5.6%, a difference of 0.19%), Egyptian (5.6%, a difference of 0.21%), Immigrants from Japan (5.6%, a difference of 0.21%), Immigrants from Sweden (5.6%, a difference of 0.22%), and Luxembourger (5.6%, a difference of 0.34%).
| Demographics | Rating | Rank | Ambulatory Disability |
| Argentineans | 99.9 /100 | #42 | Exceptional 5.5% |
| Paraguayans | 99.9 /100 | #43 | Exceptional 5.5% |
| Immigrants | Indonesia | 99.9 /100 | #44 | Exceptional 5.5% |
| Immigrants | Sweden | 99.9 /100 | #45 | Exceptional 5.6% |
| Egyptians | 99.9 /100 | #46 | Exceptional 5.6% |
| Immigrants | Japan | 99.9 /100 | #47 | Exceptional 5.6% |
| Immigrants | Argentina | 99.9 /100 | #48 | Exceptional 5.6% |
| Bulgarians | 99.9 /100 | #49 | Exceptional 5.6% |
| Luxembourgers | 99.9 /100 | #50 | Exceptional 5.6% |
| Taiwanese | 99.8 /100 | #51 | Exceptional 5.6% |
| Jordanians | 99.8 /100 | #52 | Exceptional 5.6% |
| Immigrants | Egypt | 99.8 /100 | #53 | Exceptional 5.6% |
| Immigrants | Eastern Africa | 99.8 /100 | #54 | Exceptional 5.6% |
| Immigrants | Bulgaria | 99.8 /100 | #55 | Exceptional 5.6% |
| Inupiat | 99.8 /100 | #56 | Exceptional 5.6% |
Demographics Similar to Immigrants from Cuba by Ambulatory Disability
In terms of ambulatory disability, the demographic groups most similar to Immigrants from Cuba are Immigrants from Portugal (6.5%, a difference of 0.020%), Armenian (6.5%, a difference of 0.050%), Tlingit-Haida (6.5%, a difference of 0.070%), German (6.5%, a difference of 0.10%), and Immigrants from Panama (6.5%, a difference of 0.10%).
| Demographics | Rating | Rank | Ambulatory Disability |
| Immigrants | Senegal | 1.7 /100 | #240 | Tragic 6.4% |
| Immigrants | Haiti | 1.6 /100 | #241 | Tragic 6.5% |
| Spaniards | 1.6 /100 | #242 | Tragic 6.5% |
| Germans | 1.5 /100 | #243 | Tragic 6.5% |
| Immigrants | Panama | 1.5 /100 | #244 | Tragic 6.5% |
| Tlingit-Haida | 1.5 /100 | #245 | Tragic 6.5% |
| Armenians | 1.5 /100 | #246 | Tragic 6.5% |
| Immigrants | Cuba | 1.4 /100 | #247 | Tragic 6.5% |
| Immigrants | Portugal | 1.4 /100 | #248 | Tragic 6.5% |
| Native Hawaiians | 1.1 /100 | #249 | Tragic 6.5% |
| Chinese | 1.0 /100 | #250 | Tragic 6.5% |
| Hawaiians | 0.9 /100 | #251 | Tragic 6.5% |
| Immigrants | Bahamas | 0.8 /100 | #252 | Tragic 6.5% |
| Scottish | 0.7 /100 | #253 | Tragic 6.5% |
| Belizeans | 0.7 /100 | #254 | Tragic 6.5% |