Bulgarian vs Immigrants from Barbados Vision Disability
COMPARE
Bulgarian
Immigrants from Barbados
Vision Disability
Vision Disability Comparison
Bulgarians
Immigrants from Barbados
1.9%
VISION DISABILITY
99.9/ 100
METRIC RATING
25th/ 347
METRIC RANK
2.2%
VISION DISABILITY
24.0/ 100
METRIC RATING
194th/ 347
METRIC RANK
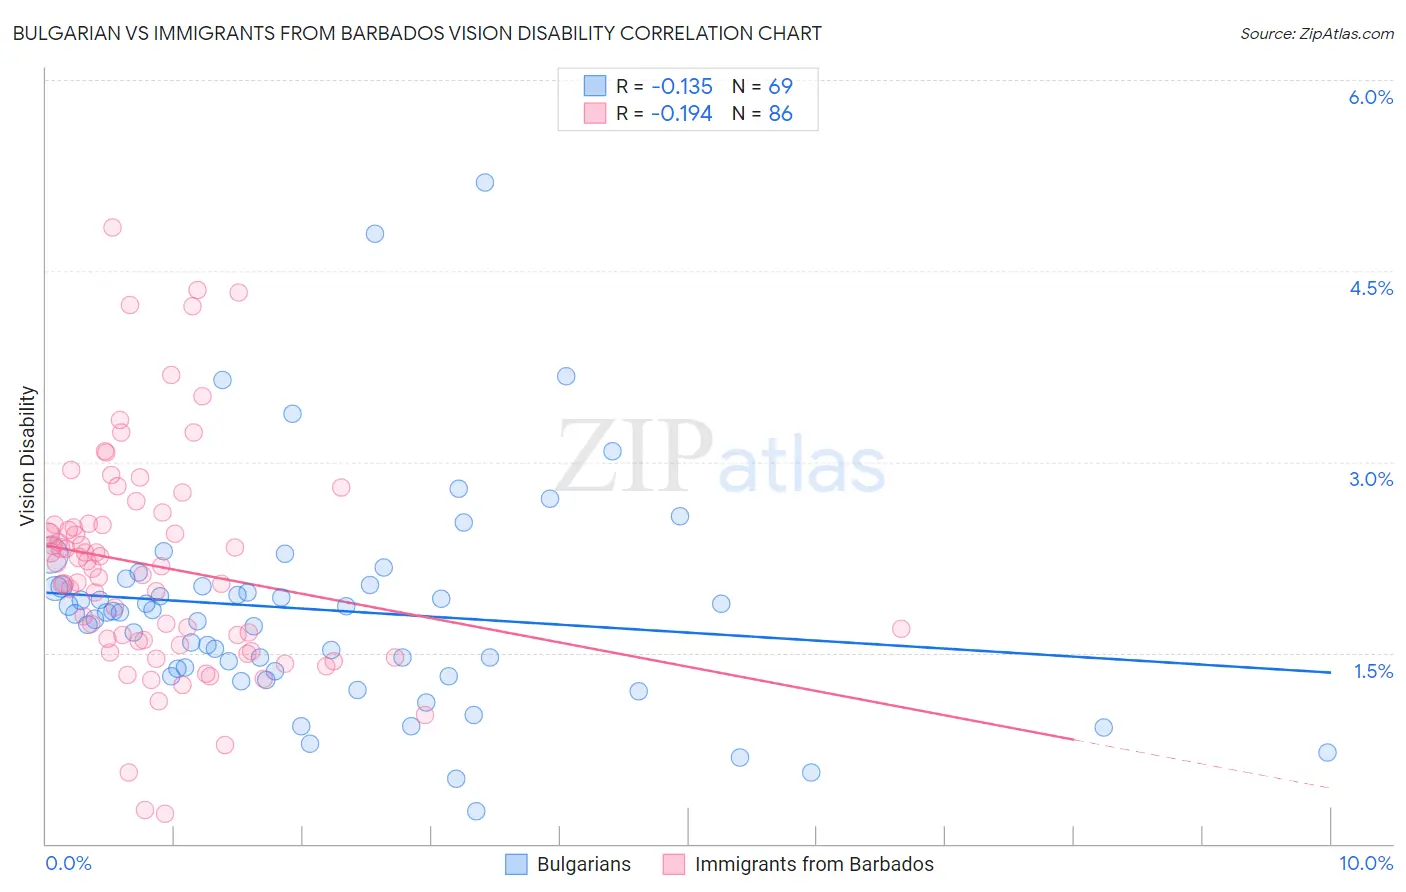
Bulgarian vs Immigrants from Barbados Vision Disability Correlation Chart
The statistical analysis conducted on geographies consisting of 205,563,576 people shows a poor negative correlation between the proportion of Bulgarians and percentage of population with vision disability in the United States with a correlation coefficient (R) of -0.135 and weighted average of 1.9%. Similarly, the statistical analysis conducted on geographies consisting of 112,772,018 people shows a poor negative correlation between the proportion of Immigrants from Barbados and percentage of population with vision disability in the United States with a correlation coefficient (R) of -0.194 and weighted average of 2.2%, a difference of 14.8%.
Vision Disability Correlation Summary
| Measurement | Bulgarian | Immigrants from Barbados |
| Minimum | 0.26% | 0.23% |
| Maximum | 5.2% | 4.8% |
| Range | 4.9% | 4.6% |
| Mean | 1.8% | 2.2% |
| Median | 1.8% | 2.2% |
| Interquartile 25% (IQ1) | 1.3% | 1.6% |
| Interquartile 75% (IQ3) | 2.0% | 2.5% |
| Interquartile Range (IQR) | 0.69% | 0.91% |
| Standard Deviation (Sample) | 0.87% | 0.87% |
| Standard Deviation (Population) | 0.86% | 0.87% |
Similar Demographics by Vision Disability
Demographics Similar to Bulgarians by Vision Disability
In terms of vision disability, the demographic groups most similar to Bulgarians are Immigrants from Lithuania (1.9%, a difference of 0.040%), Immigrants from Japan (1.9%, a difference of 0.040%), Immigrants from Asia (1.9%, a difference of 0.16%), Taiwanese (1.9%, a difference of 0.37%), and Immigrants from Malaysia (1.9%, a difference of 0.40%).
| Demographics | Rating | Rank | Vision Disability |
| Bolivians | 100.0 /100 | #18 | Exceptional 1.9% |
| Immigrants | Sri Lanka | 100.0 /100 | #19 | Exceptional 1.9% |
| Asians | 100.0 /100 | #20 | Exceptional 1.9% |
| Turks | 100.0 /100 | #21 | Exceptional 1.9% |
| Immigrants | Pakistan | 100.0 /100 | #22 | Exceptional 1.9% |
| Immigrants | Asia | 99.9 /100 | #23 | Exceptional 1.9% |
| Immigrants | Lithuania | 99.9 /100 | #24 | Exceptional 1.9% |
| Bulgarians | 99.9 /100 | #25 | Exceptional 1.9% |
| Immigrants | Japan | 99.9 /100 | #26 | Exceptional 1.9% |
| Taiwanese | 99.9 /100 | #27 | Exceptional 1.9% |
| Immigrants | Malaysia | 99.9 /100 | #28 | Exceptional 1.9% |
| Egyptians | 99.9 /100 | #29 | Exceptional 1.9% |
| Immigrants | Nepal | 99.9 /100 | #30 | Exceptional 1.9% |
| Mongolians | 99.9 /100 | #31 | Exceptional 1.9% |
| Luxembourgers | 99.9 /100 | #32 | Exceptional 1.9% |
Demographics Similar to Immigrants from Barbados by Vision Disability
In terms of vision disability, the demographic groups most similar to Immigrants from Barbados are Immigrants (2.2%, a difference of 0.020%), Immigrants from Grenada (2.2%, a difference of 0.070%), British (2.2%, a difference of 0.090%), Canadian (2.2%, a difference of 0.15%), and European (2.2%, a difference of 0.15%).
| Demographics | Rating | Rank | Vision Disability |
| Immigrants | St. Vincent and the Grenadines | 30.3 /100 | #187 | Fair 2.2% |
| Guyanese | 28.9 /100 | #188 | Fair 2.2% |
| Salvadorans | 27.4 /100 | #189 | Fair 2.2% |
| Immigrants | Costa Rica | 26.1 /100 | #190 | Fair 2.2% |
| Canadians | 25.8 /100 | #191 | Fair 2.2% |
| Europeans | 25.7 /100 | #192 | Fair 2.2% |
| British | 25.1 /100 | #193 | Fair 2.2% |
| Immigrants | Barbados | 24.0 /100 | #194 | Fair 2.2% |
| Immigrants | Immigrants | 23.7 /100 | #195 | Fair 2.2% |
| Immigrants | Grenada | 23.1 /100 | #196 | Fair 2.2% |
| Ghanaians | 21.8 /100 | #197 | Fair 2.2% |
| Czechoslovakians | 21.6 /100 | #198 | Fair 2.2% |
| Immigrants | El Salvador | 21.0 /100 | #199 | Fair 2.2% |
| Immigrants | Thailand | 20.1 /100 | #200 | Fair 2.2% |
| Slovaks | 18.8 /100 | #201 | Poor 2.2% |