Bulgarian vs Immigrants from Barbados Unemployment Among Ages 45 to 54 years
COMPARE
Bulgarian
Immigrants from Barbados
Unemployment Among Ages 45 to 54 years
Unemployment Among Ages 45 to 54 years Comparison
Bulgarians
Immigrants from Barbados
4.1%
UNEMPLOYMENT AMONG AGES 45 TO 54 YEARS
100.0/ 100
METRIC RATING
23rd/ 347
METRIC RANK
5.5%
UNEMPLOYMENT AMONG AGES 45 TO 54 YEARS
0.0/ 100
METRIC RATING
310th/ 347
METRIC RANK
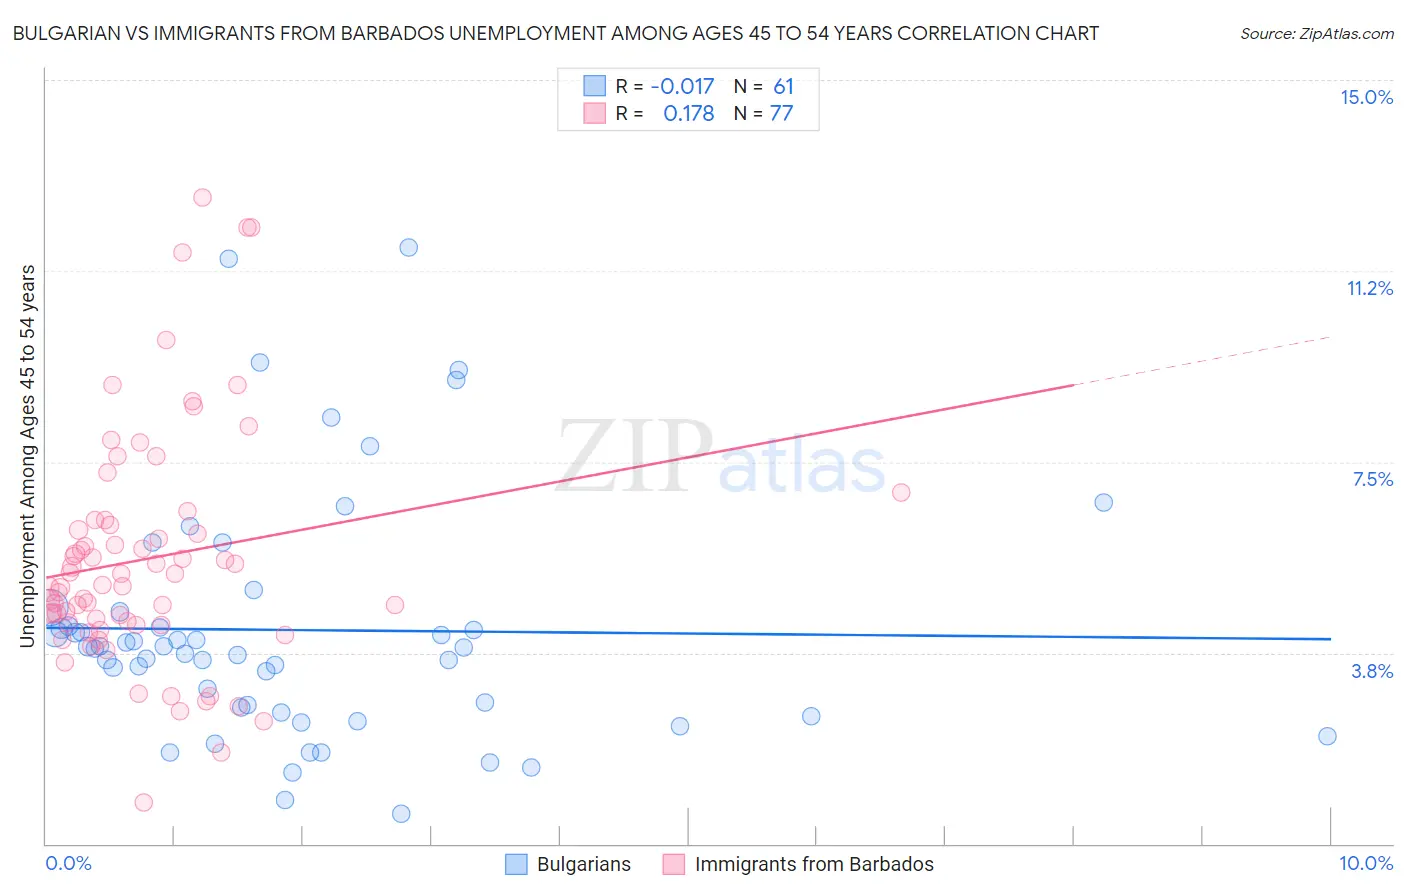
Bulgarian vs Immigrants from Barbados Unemployment Among Ages 45 to 54 years Correlation Chart
The statistical analysis conducted on geographies consisting of 203,004,749 people shows no correlation between the proportion of Bulgarians and unemployment rate among population between the ages 45 and 54 in the United States with a correlation coefficient (R) of -0.017 and weighted average of 4.1%. Similarly, the statistical analysis conducted on geographies consisting of 112,020,892 people shows a poor positive correlation between the proportion of Immigrants from Barbados and unemployment rate among population between the ages 45 and 54 in the United States with a correlation coefficient (R) of 0.178 and weighted average of 5.5%, a difference of 33.7%.
Unemployment Among Ages 45 to 54 years Correlation Summary
| Measurement | Bulgarian | Immigrants from Barbados |
| Minimum | 0.60% | 0.80% |
| Maximum | 11.7% | 12.7% |
| Range | 11.1% | 11.9% |
| Mean | 4.2% | 5.6% |
| Median | 3.9% | 5.1% |
| Interquartile 25% (IQ1) | 2.6% | 4.3% |
| Interquartile 75% (IQ3) | 4.4% | 6.3% |
| Interquartile Range (IQR) | 1.8% | 2.0% |
| Standard Deviation (Sample) | 2.4% | 2.3% |
| Standard Deviation (Population) | 2.4% | 2.3% |
Similar Demographics by Unemployment Among Ages 45 to 54 years
Demographics Similar to Bulgarians by Unemployment Among Ages 45 to 54 years
In terms of unemployment among ages 45 to 54 years, the demographic groups most similar to Bulgarians are Yugoslavian (4.1%, a difference of 0.010%), European (4.1%, a difference of 0.10%), English (4.1%, a difference of 0.42%), Swiss (4.1%, a difference of 0.58%), and Carpatho Rusyn (4.1%, a difference of 0.65%).
| Demographics | Rating | Rank | Unemployment Among Ages 45 to 54 years |
| Thais | 100.0 /100 | #16 | Exceptional 4.0% |
| Tongans | 100.0 /100 | #17 | Exceptional 4.1% |
| Germans | 100.0 /100 | #18 | Exceptional 4.1% |
| Swiss | 100.0 /100 | #19 | Exceptional 4.1% |
| English | 100.0 /100 | #20 | Exceptional 4.1% |
| Europeans | 100.0 /100 | #21 | Exceptional 4.1% |
| Yugoslavians | 100.0 /100 | #22 | Exceptional 4.1% |
| Bulgarians | 100.0 /100 | #23 | Exceptional 4.1% |
| Carpatho Rusyns | 100.0 /100 | #24 | Exceptional 4.1% |
| Bolivians | 99.9 /100 | #25 | Exceptional 4.1% |
| Scottish | 99.9 /100 | #26 | Exceptional 4.1% |
| Immigrants | Moldova | 99.9 /100 | #27 | Exceptional 4.1% |
| Welsh | 99.9 /100 | #28 | Exceptional 4.1% |
| Belgians | 99.9 /100 | #29 | Exceptional 4.1% |
| British | 99.9 /100 | #30 | Exceptional 4.1% |
Demographics Similar to Immigrants from Barbados by Unemployment Among Ages 45 to 54 years
In terms of unemployment among ages 45 to 54 years, the demographic groups most similar to Immigrants from Barbados are Barbadian (5.5%, a difference of 0.15%), Chippewa (5.5%, a difference of 0.28%), Black/African American (5.4%, a difference of 0.80%), Vietnamese (5.4%, a difference of 1.6%), and Immigrants from Bangladesh (5.4%, a difference of 1.8%).
| Demographics | Rating | Rank | Unemployment Among Ages 45 to 54 years |
| Immigrants | Belize | 0.0 /100 | #303 | Tragic 5.3% |
| Immigrants | Jamaica | 0.0 /100 | #304 | Tragic 5.4% |
| Immigrants | West Indies | 0.0 /100 | #305 | Tragic 5.4% |
| Immigrants | Bangladesh | 0.0 /100 | #306 | Tragic 5.4% |
| Vietnamese | 0.0 /100 | #307 | Tragic 5.4% |
| Blacks/African Americans | 0.0 /100 | #308 | Tragic 5.4% |
| Barbadians | 0.0 /100 | #309 | Tragic 5.5% |
| Immigrants | Barbados | 0.0 /100 | #310 | Tragic 5.5% |
| Chippewa | 0.0 /100 | #311 | Tragic 5.5% |
| Immigrants | Grenada | 0.0 /100 | #312 | Tragic 5.6% |
| Shoshone | 0.0 /100 | #313 | Tragic 5.6% |
| Guyanese | 0.0 /100 | #314 | Tragic 5.6% |
| Immigrants | Dominica | 0.0 /100 | #315 | Tragic 5.6% |
| Immigrants | Guyana | 0.0 /100 | #316 | Tragic 5.6% |
| Houma | 0.0 /100 | #317 | Tragic 5.6% |