Bulgarian vs Immigrants from Barbados Master's Degree
COMPARE
Bulgarian
Immigrants from Barbados
Master's Degree
Master's Degree Comparison
Bulgarians
Immigrants from Barbados
18.8%
MASTER'S DEGREE
100.0/ 100
METRIC RATING
50th/ 347
METRIC RANK
14.3%
MASTER'S DEGREE
20.5/ 100
METRIC RATING
208th/ 347
METRIC RANK
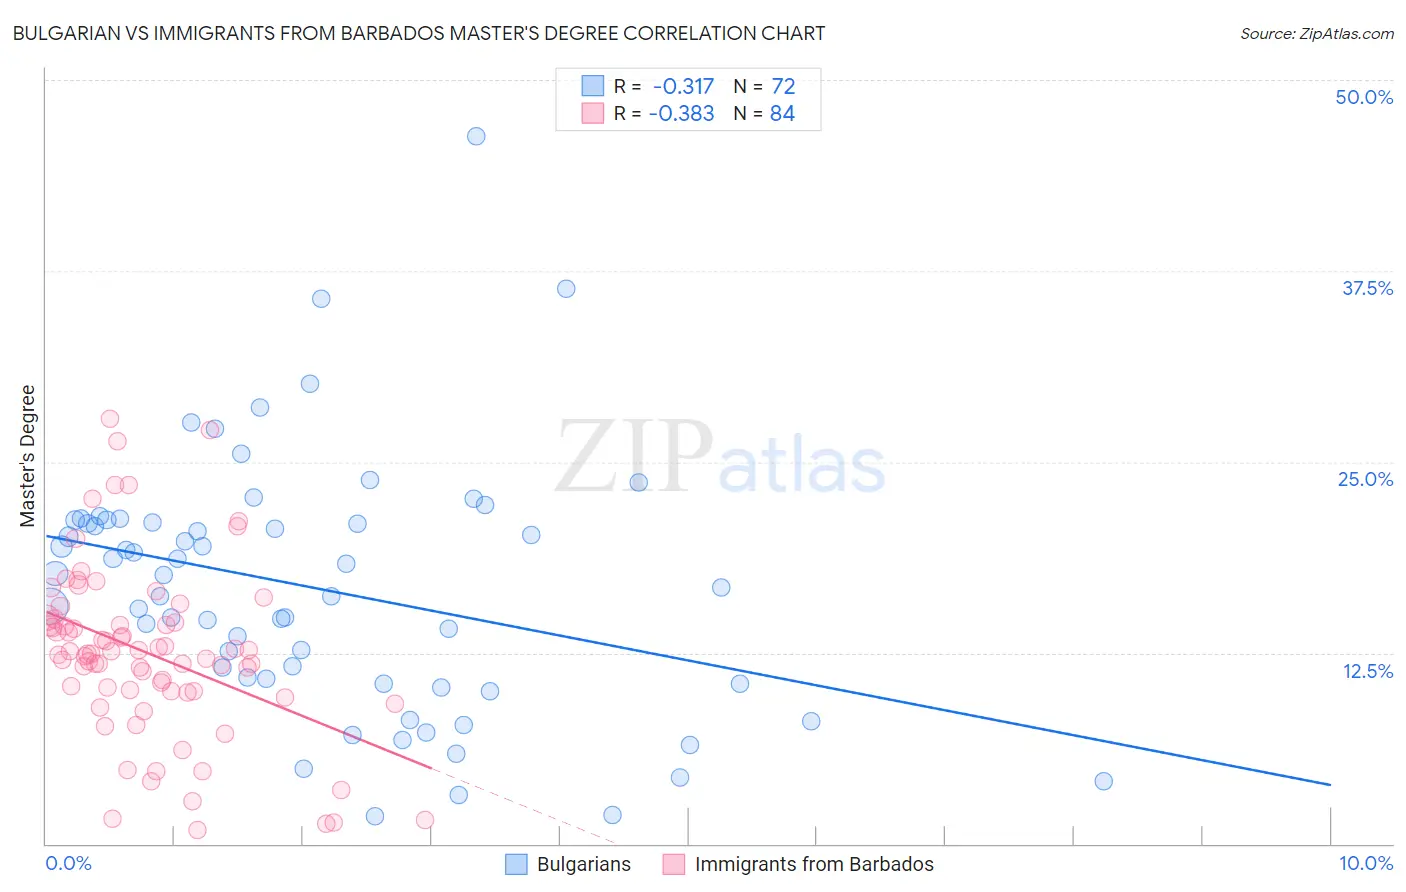
Bulgarian vs Immigrants from Barbados Master's Degree Correlation Chart
The statistical analysis conducted on geographies consisting of 205,591,570 people shows a mild negative correlation between the proportion of Bulgarians and percentage of population with at least master's degree education in the United States with a correlation coefficient (R) of -0.317 and weighted average of 18.8%. Similarly, the statistical analysis conducted on geographies consisting of 112,776,866 people shows a mild negative correlation between the proportion of Immigrants from Barbados and percentage of population with at least master's degree education in the United States with a correlation coefficient (R) of -0.383 and weighted average of 14.3%, a difference of 31.4%.
Master's Degree Correlation Summary
| Measurement | Bulgarian | Immigrants from Barbados |
| Minimum | 1.8% | 0.92% |
| Maximum | 46.3% | 27.8% |
| Range | 44.5% | 26.9% |
| Mean | 16.7% | 12.5% |
| Median | 17.2% | 12.4% |
| Interquartile 25% (IQ1) | 10.6% | 10.0% |
| Interquartile 75% (IQ3) | 21.1% | 14.6% |
| Interquartile Range (IQR) | 10.4% | 4.6% |
| Standard Deviation (Sample) | 8.3% | 5.7% |
| Standard Deviation (Population) | 8.2% | 5.6% |
Similar Demographics by Master's Degree
Demographics Similar to Bulgarians by Master's Degree
In terms of master's degree, the demographic groups most similar to Bulgarians are Immigrants from South Africa (18.8%, a difference of 0.010%), Estonian (18.8%, a difference of 0.19%), Paraguayan (18.8%, a difference of 0.28%), Immigrants from Austria (18.8%, a difference of 0.34%), and Immigrants from Norway (18.8%, a difference of 0.35%).
| Demographics | Rating | Rank | Master's Degree |
| Immigrants | Greece | 100.0 /100 | #43 | Exceptional 19.0% |
| Immigrants | Malaysia | 100.0 /100 | #44 | Exceptional 18.9% |
| Immigrants | Belarus | 100.0 /100 | #45 | Exceptional 18.9% |
| Immigrants | Norway | 100.0 /100 | #46 | Exceptional 18.8% |
| Immigrants | Austria | 100.0 /100 | #47 | Exceptional 18.8% |
| Paraguayans | 100.0 /100 | #48 | Exceptional 18.8% |
| Estonians | 100.0 /100 | #49 | Exceptional 18.8% |
| Bulgarians | 100.0 /100 | #50 | Exceptional 18.8% |
| Immigrants | South Africa | 100.0 /100 | #51 | Exceptional 18.8% |
| Immigrants | Kuwait | 100.0 /100 | #52 | Exceptional 18.6% |
| Immigrants | Czechoslovakia | 99.9 /100 | #53 | Exceptional 18.5% |
| Immigrants | Lithuania | 99.9 /100 | #54 | Exceptional 18.5% |
| Immigrants | Serbia | 99.9 /100 | #55 | Exceptional 18.5% |
| Asians | 99.9 /100 | #56 | Exceptional 18.4% |
| Immigrants | Asia | 99.9 /100 | #57 | Exceptional 18.4% |
Demographics Similar to Immigrants from Barbados by Master's Degree
In terms of master's degree, the demographic groups most similar to Immigrants from Barbados are Immigrants from Panama (14.3%, a difference of 0.090%), Subsaharan African (14.2%, a difference of 0.22%), Immigrants from Bosnia and Herzegovina (14.3%, a difference of 0.30%), Somali (14.2%, a difference of 0.53%), and Scandinavian (14.4%, a difference of 0.55%).
| Demographics | Rating | Rank | Master's Degree |
| Scotch-Irish | 25.0 /100 | #201 | Fair 14.4% |
| Immigrants | Western Africa | 24.9 /100 | #202 | Fair 14.4% |
| Yugoslavians | 24.3 /100 | #203 | Fair 14.4% |
| French | 23.7 /100 | #204 | Fair 14.4% |
| Trinidadians and Tobagonians | 23.5 /100 | #205 | Fair 14.4% |
| Scandinavians | 23.3 /100 | #206 | Fair 14.4% |
| Immigrants | Bosnia and Herzegovina | 22.0 /100 | #207 | Fair 14.3% |
| Immigrants | Barbados | 20.5 /100 | #208 | Fair 14.3% |
| Immigrants | Panama | 20.0 /100 | #209 | Fair 14.3% |
| Sub-Saharan Africans | 19.4 /100 | #210 | Poor 14.2% |
| Somalis | 18.0 /100 | #211 | Poor 14.2% |
| Spanish | 17.8 /100 | #212 | Poor 14.2% |
| Immigrants | Thailand | 17.0 /100 | #213 | Poor 14.2% |
| Finns | 16.9 /100 | #214 | Poor 14.2% |
| Immigrants | Vietnam | 16.1 /100 | #215 | Poor 14.1% |