Panamanian vs Immigrants from Barbados Vision Disability
COMPARE
Panamanian
Immigrants from Barbados
Vision Disability
Vision Disability Comparison
Panamanians
Immigrants from Barbados
2.3%
VISION DISABILITY
0.9/ 100
METRIC RATING
240th/ 347
METRIC RANK
2.2%
VISION DISABILITY
24.0/ 100
METRIC RATING
194th/ 347
METRIC RANK
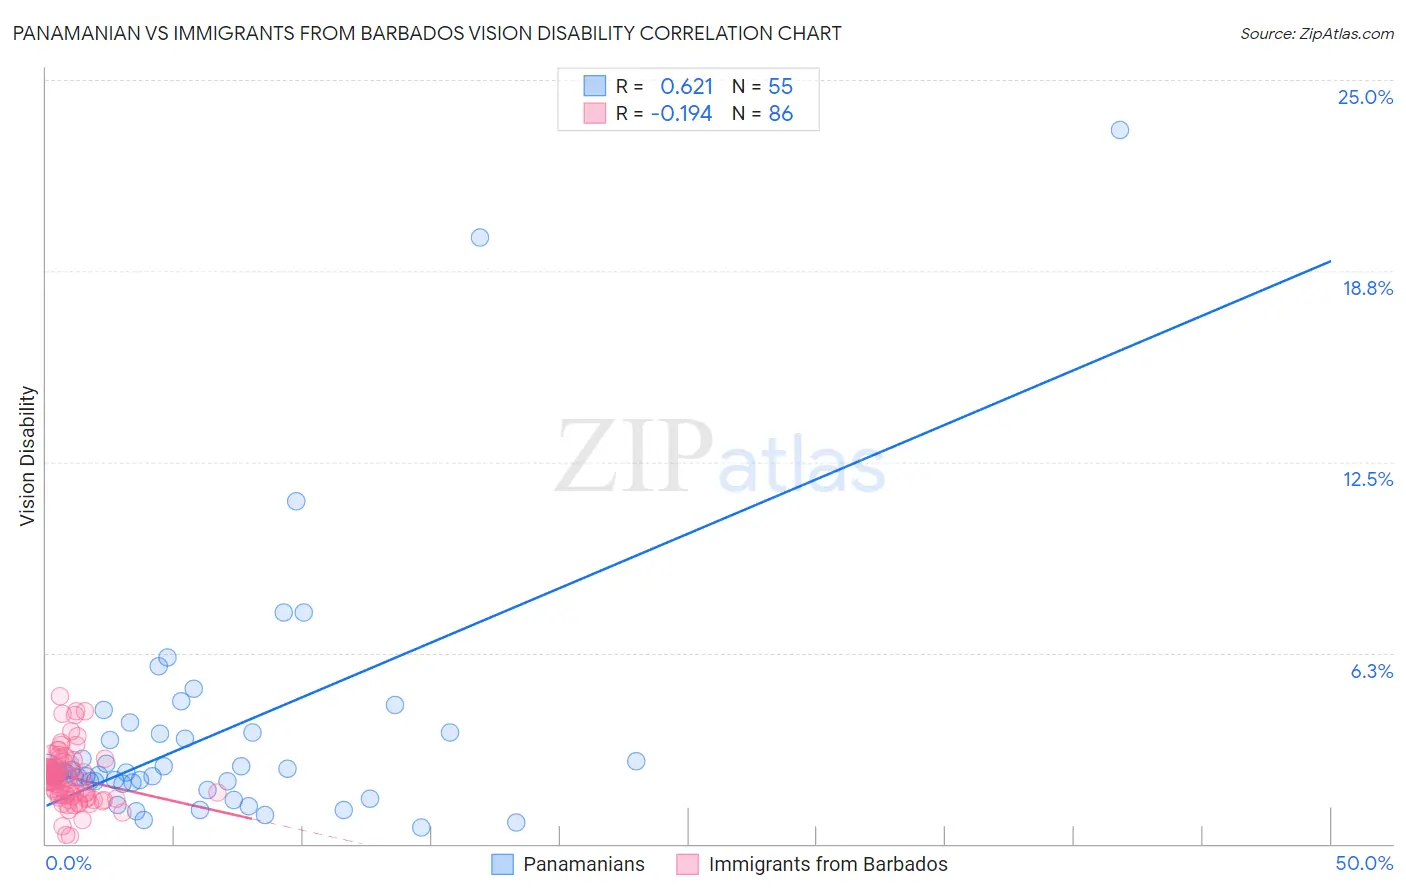
Panamanian vs Immigrants from Barbados Vision Disability Correlation Chart
The statistical analysis conducted on geographies consisting of 281,084,996 people shows a significant positive correlation between the proportion of Panamanians and percentage of population with vision disability in the United States with a correlation coefficient (R) of 0.621 and weighted average of 2.3%. Similarly, the statistical analysis conducted on geographies consisting of 112,772,018 people shows a poor negative correlation between the proportion of Immigrants from Barbados and percentage of population with vision disability in the United States with a correlation coefficient (R) of -0.194 and weighted average of 2.2%, a difference of 5.4%.
Vision Disability Correlation Summary
| Measurement | Panamanian | Immigrants from Barbados |
| Minimum | 0.54% | 0.23% |
| Maximum | 23.4% | 4.8% |
| Range | 22.8% | 4.6% |
| Mean | 3.5% | 2.2% |
| Median | 2.3% | 2.2% |
| Interquartile 25% (IQ1) | 2.0% | 1.6% |
| Interquartile 75% (IQ3) | 3.6% | 2.5% |
| Interquartile Range (IQR) | 1.6% | 0.91% |
| Standard Deviation (Sample) | 4.0% | 0.87% |
| Standard Deviation (Population) | 4.0% | 0.87% |
Similar Demographics by Vision Disability
Demographics Similar to Panamanians by Vision Disability
In terms of vision disability, the demographic groups most similar to Panamanians are Malaysian (2.3%, a difference of 0.030%), Immigrants from Panama (2.3%, a difference of 0.18%), English (2.3%, a difference of 0.25%), Immigrants from Cambodia (2.3%, a difference of 0.27%), and Immigrants from Portugal (2.3%, a difference of 0.54%).
| Demographics | Rating | Rank | Vision Disability |
| Central Americans | 1.8 /100 | #233 | Tragic 2.3% |
| Scottish | 1.6 /100 | #234 | Tragic 2.3% |
| Marshallese | 1.5 /100 | #235 | Tragic 2.3% |
| Immigrants | Congo | 1.4 /100 | #236 | Tragic 2.3% |
| Immigrants | Portugal | 1.4 /100 | #237 | Tragic 2.3% |
| Immigrants | Cambodia | 1.1 /100 | #238 | Tragic 2.3% |
| English | 1.1 /100 | #239 | Tragic 2.3% |
| Panamanians | 0.9 /100 | #240 | Tragic 2.3% |
| Malaysians | 0.9 /100 | #241 | Tragic 2.3% |
| Immigrants | Panama | 0.8 /100 | #242 | Tragic 2.3% |
| Immigrants | Nicaragua | 0.6 /100 | #243 | Tragic 2.3% |
| Immigrants | West Indies | 0.6 /100 | #244 | Tragic 2.3% |
| Alsatians | 0.6 /100 | #245 | Tragic 2.3% |
| French | 0.5 /100 | #246 | Tragic 2.3% |
| Guatemalans | 0.5 /100 | #247 | Tragic 2.3% |
Demographics Similar to Immigrants from Barbados by Vision Disability
In terms of vision disability, the demographic groups most similar to Immigrants from Barbados are Immigrants (2.2%, a difference of 0.020%), Immigrants from Grenada (2.2%, a difference of 0.070%), British (2.2%, a difference of 0.090%), Canadian (2.2%, a difference of 0.15%), and European (2.2%, a difference of 0.15%).
| Demographics | Rating | Rank | Vision Disability |
| Immigrants | St. Vincent and the Grenadines | 30.3 /100 | #187 | Fair 2.2% |
| Guyanese | 28.9 /100 | #188 | Fair 2.2% |
| Salvadorans | 27.4 /100 | #189 | Fair 2.2% |
| Immigrants | Costa Rica | 26.1 /100 | #190 | Fair 2.2% |
| Canadians | 25.8 /100 | #191 | Fair 2.2% |
| Europeans | 25.7 /100 | #192 | Fair 2.2% |
| British | 25.1 /100 | #193 | Fair 2.2% |
| Immigrants | Barbados | 24.0 /100 | #194 | Fair 2.2% |
| Immigrants | Immigrants | 23.7 /100 | #195 | Fair 2.2% |
| Immigrants | Grenada | 23.1 /100 | #196 | Fair 2.2% |
| Ghanaians | 21.8 /100 | #197 | Fair 2.2% |
| Czechoslovakians | 21.6 /100 | #198 | Fair 2.2% |
| Immigrants | El Salvador | 21.0 /100 | #199 | Fair 2.2% |
| Immigrants | Thailand | 20.1 /100 | #200 | Fair 2.2% |
| Slovaks | 18.8 /100 | #201 | Poor 2.2% |