Bulgarian vs Austrian Vision Disability
COMPARE
Bulgarian
Austrian
Vision Disability
Vision Disability Comparison
Bulgarians
Austrians
1.9%
VISION DISABILITY
99.9/ 100
METRIC RATING
25th/ 347
METRIC RANK
2.1%
VISION DISABILITY
69.0/ 100
METRIC RATING
160th/ 347
METRIC RANK
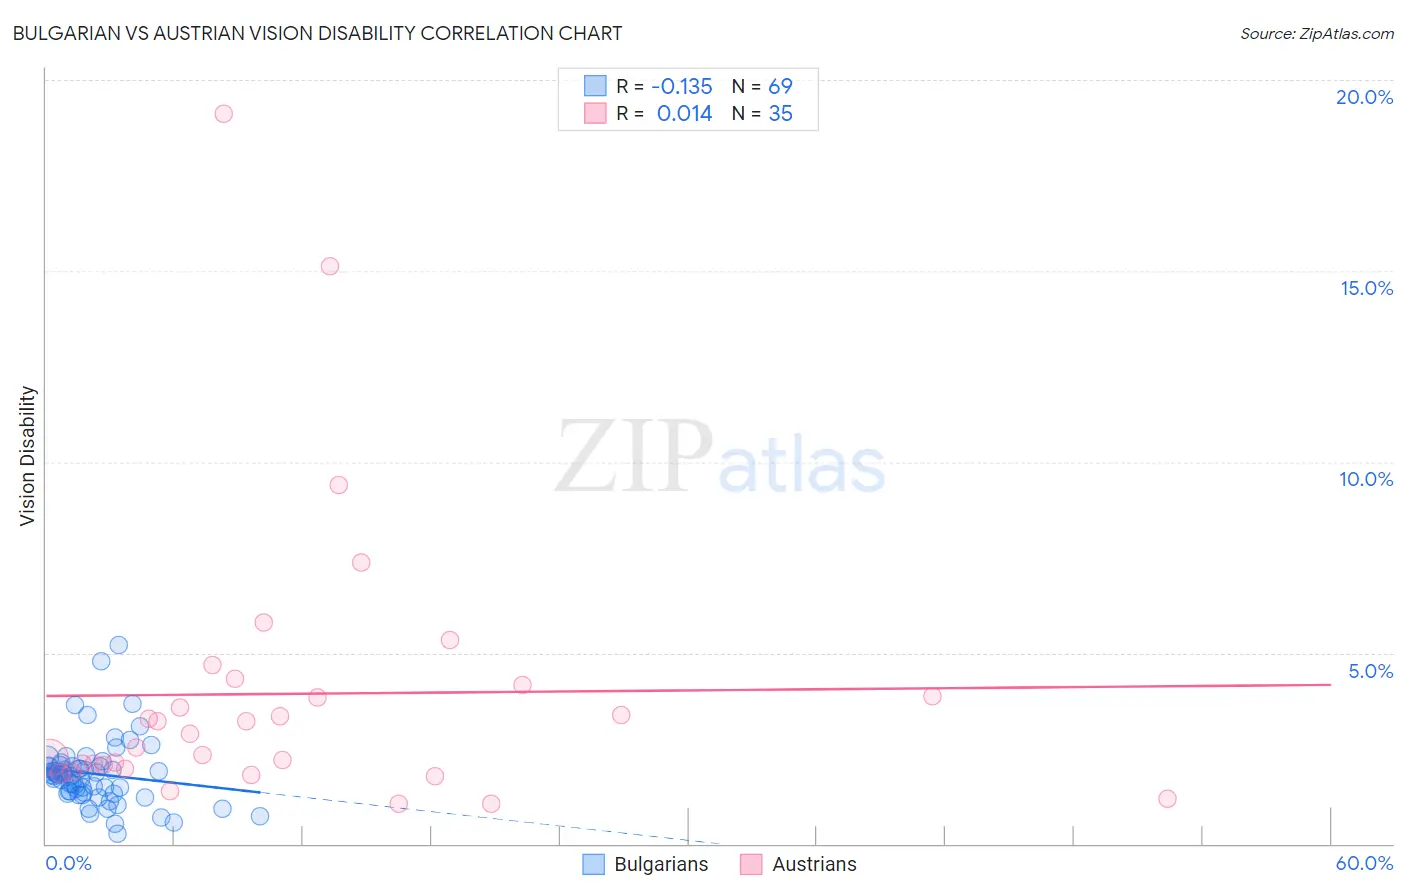
Bulgarian vs Austrian Vision Disability Correlation Chart
The statistical analysis conducted on geographies consisting of 205,563,576 people shows a poor negative correlation between the proportion of Bulgarians and percentage of population with vision disability in the United States with a correlation coefficient (R) of -0.135 and weighted average of 1.9%. Similarly, the statistical analysis conducted on geographies consisting of 451,572,198 people shows no correlation between the proportion of Austrians and percentage of population with vision disability in the United States with a correlation coefficient (R) of 0.014 and weighted average of 2.1%, a difference of 11.4%.
Vision Disability Correlation Summary
| Measurement | Bulgarian | Austrian |
| Minimum | 0.26% | 1.0% |
| Maximum | 5.2% | 19.1% |
| Range | 4.9% | 18.1% |
| Mean | 1.8% | 3.9% |
| Median | 1.8% | 2.9% |
| Interquartile 25% (IQ1) | 1.3% | 2.0% |
| Interquartile 75% (IQ3) | 2.0% | 4.2% |
| Interquartile Range (IQR) | 0.69% | 2.2% |
| Standard Deviation (Sample) | 0.87% | 3.8% |
| Standard Deviation (Population) | 0.86% | 3.7% |
Similar Demographics by Vision Disability
Demographics Similar to Bulgarians by Vision Disability
In terms of vision disability, the demographic groups most similar to Bulgarians are Immigrants from Lithuania (1.9%, a difference of 0.040%), Immigrants from Japan (1.9%, a difference of 0.040%), Immigrants from Asia (1.9%, a difference of 0.16%), Taiwanese (1.9%, a difference of 0.37%), and Immigrants from Malaysia (1.9%, a difference of 0.40%).
| Demographics | Rating | Rank | Vision Disability |
| Bolivians | 100.0 /100 | #18 | Exceptional 1.9% |
| Immigrants | Sri Lanka | 100.0 /100 | #19 | Exceptional 1.9% |
| Asians | 100.0 /100 | #20 | Exceptional 1.9% |
| Turks | 100.0 /100 | #21 | Exceptional 1.9% |
| Immigrants | Pakistan | 100.0 /100 | #22 | Exceptional 1.9% |
| Immigrants | Asia | 99.9 /100 | #23 | Exceptional 1.9% |
| Immigrants | Lithuania | 99.9 /100 | #24 | Exceptional 1.9% |
| Bulgarians | 99.9 /100 | #25 | Exceptional 1.9% |
| Immigrants | Japan | 99.9 /100 | #26 | Exceptional 1.9% |
| Taiwanese | 99.9 /100 | #27 | Exceptional 1.9% |
| Immigrants | Malaysia | 99.9 /100 | #28 | Exceptional 1.9% |
| Egyptians | 99.9 /100 | #29 | Exceptional 1.9% |
| Immigrants | Nepal | 99.9 /100 | #30 | Exceptional 1.9% |
| Mongolians | 99.9 /100 | #31 | Exceptional 1.9% |
| Luxembourgers | 99.9 /100 | #32 | Exceptional 1.9% |
Demographics Similar to Austrians by Vision Disability
In terms of vision disability, the demographic groups most similar to Austrians are South African (2.1%, a difference of 0.060%), Immigrants from Uzbekistan (2.1%, a difference of 0.070%), Serbian (2.1%, a difference of 0.090%), Iraqi (2.1%, a difference of 0.090%), and Hungarian (2.1%, a difference of 0.12%).
| Demographics | Rating | Rank | Vision Disability |
| Immigrants | South America | 73.8 /100 | #153 | Good 2.1% |
| Slovenes | 73.6 /100 | #154 | Good 2.1% |
| Immigrants | Colombia | 72.1 /100 | #155 | Good 2.1% |
| Pakistanis | 71.6 /100 | #156 | Good 2.1% |
| Serbians | 70.2 /100 | #157 | Good 2.1% |
| Immigrants | Uzbekistan | 69.9 /100 | #158 | Good 2.1% |
| South Africans | 69.8 /100 | #159 | Good 2.1% |
| Austrians | 69.0 /100 | #160 | Good 2.1% |
| Iraqis | 67.7 /100 | #161 | Good 2.1% |
| Hungarians | 67.4 /100 | #162 | Good 2.1% |
| Icelanders | 66.1 /100 | #163 | Good 2.1% |
| Immigrants | Bangladesh | 65.5 /100 | #164 | Good 2.1% |
| Immigrants | Iraq | 64.8 /100 | #165 | Good 2.1% |
| Immigrants | England | 62.8 /100 | #166 | Good 2.1% |
| Immigrants | Africa | 62.6 /100 | #167 | Good 2.1% |