Bulgarian vs Maltese Vision Disability
COMPARE
Bulgarian
Maltese
Vision Disability
Vision Disability Comparison
Bulgarians
Maltese
1.9%
VISION DISABILITY
99.9/ 100
METRIC RATING
25th/ 347
METRIC RANK
2.0%
VISION DISABILITY
98.9/ 100
METRIC RATING
65th/ 347
METRIC RANK
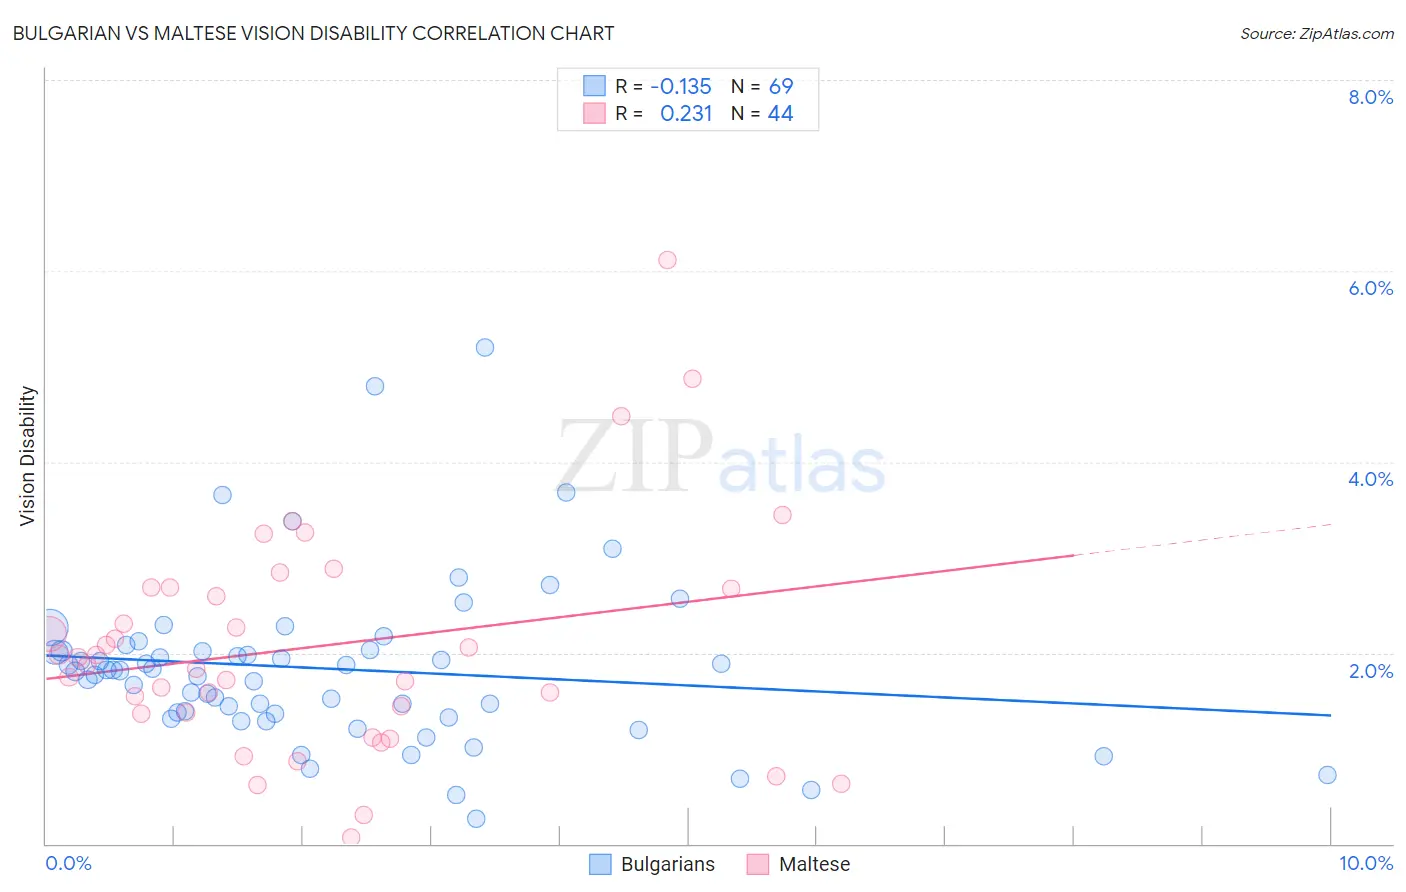
Bulgarian vs Maltese Vision Disability Correlation Chart
The statistical analysis conducted on geographies consisting of 205,563,576 people shows a poor negative correlation between the proportion of Bulgarians and percentage of population with vision disability in the United States with a correlation coefficient (R) of -0.135 and weighted average of 1.9%. Similarly, the statistical analysis conducted on geographies consisting of 126,445,167 people shows a weak positive correlation between the proportion of Maltese and percentage of population with vision disability in the United States with a correlation coefficient (R) of 0.231 and weighted average of 2.0%, a difference of 4.8%.
Vision Disability Correlation Summary
| Measurement | Bulgarian | Maltese |
| Minimum | 0.26% | 0.070% |
| Maximum | 5.2% | 6.1% |
| Range | 4.9% | 6.0% |
| Mean | 1.8% | 2.1% |
| Median | 1.8% | 1.9% |
| Interquartile 25% (IQ1) | 1.3% | 1.4% |
| Interquartile 75% (IQ3) | 2.0% | 2.7% |
| Interquartile Range (IQR) | 0.69% | 1.3% |
| Standard Deviation (Sample) | 0.87% | 1.2% |
| Standard Deviation (Population) | 0.86% | 1.2% |
Similar Demographics by Vision Disability
Demographics Similar to Bulgarians by Vision Disability
In terms of vision disability, the demographic groups most similar to Bulgarians are Immigrants from Lithuania (1.9%, a difference of 0.040%), Immigrants from Japan (1.9%, a difference of 0.040%), Immigrants from Asia (1.9%, a difference of 0.16%), Taiwanese (1.9%, a difference of 0.37%), and Immigrants from Malaysia (1.9%, a difference of 0.40%).
| Demographics | Rating | Rank | Vision Disability |
| Bolivians | 100.0 /100 | #18 | Exceptional 1.9% |
| Immigrants | Sri Lanka | 100.0 /100 | #19 | Exceptional 1.9% |
| Asians | 100.0 /100 | #20 | Exceptional 1.9% |
| Turks | 100.0 /100 | #21 | Exceptional 1.9% |
| Immigrants | Pakistan | 100.0 /100 | #22 | Exceptional 1.9% |
| Immigrants | Asia | 99.9 /100 | #23 | Exceptional 1.9% |
| Immigrants | Lithuania | 99.9 /100 | #24 | Exceptional 1.9% |
| Bulgarians | 99.9 /100 | #25 | Exceptional 1.9% |
| Immigrants | Japan | 99.9 /100 | #26 | Exceptional 1.9% |
| Taiwanese | 99.9 /100 | #27 | Exceptional 1.9% |
| Immigrants | Malaysia | 99.9 /100 | #28 | Exceptional 1.9% |
| Egyptians | 99.9 /100 | #29 | Exceptional 1.9% |
| Immigrants | Nepal | 99.9 /100 | #30 | Exceptional 1.9% |
| Mongolians | 99.9 /100 | #31 | Exceptional 1.9% |
| Luxembourgers | 99.9 /100 | #32 | Exceptional 1.9% |
Demographics Similar to Maltese by Vision Disability
In terms of vision disability, the demographic groups most similar to Maltese are Immigrants from Argentina (2.0%, a difference of 0.060%), Immigrants from Greece (2.0%, a difference of 0.070%), Immigrants from Northern Africa (2.0%, a difference of 0.17%), Armenian (2.0%, a difference of 0.20%), and Immigrants from Czechoslovakia (2.0%, a difference of 0.27%).
| Demographics | Rating | Rank | Vision Disability |
| Immigrants | Saudi Arabia | 99.2 /100 | #58 | Exceptional 2.0% |
| Argentineans | 99.1 /100 | #59 | Exceptional 2.0% |
| Immigrants | Romania | 99.1 /100 | #60 | Exceptional 2.0% |
| Immigrants | Belgium | 99.1 /100 | #61 | Exceptional 2.0% |
| Immigrants | Russia | 99.1 /100 | #62 | Exceptional 2.0% |
| Armenians | 99.0 /100 | #63 | Exceptional 2.0% |
| Immigrants | Greece | 99.0 /100 | #64 | Exceptional 2.0% |
| Maltese | 98.9 /100 | #65 | Exceptional 2.0% |
| Immigrants | Argentina | 98.9 /100 | #66 | Exceptional 2.0% |
| Immigrants | Northern Africa | 98.8 /100 | #67 | Exceptional 2.0% |
| Immigrants | Czechoslovakia | 98.7 /100 | #68 | Exceptional 2.0% |
| Russians | 98.6 /100 | #69 | Exceptional 2.0% |
| Immigrants | Kazakhstan | 98.6 /100 | #70 | Exceptional 2.0% |
| Immigrants | Northern Europe | 98.6 /100 | #71 | Exceptional 2.0% |
| Immigrants | France | 98.5 /100 | #72 | Exceptional 2.0% |