Bulgarian vs Immigrants from Western Europe Vision Disability
COMPARE
Bulgarian
Immigrants from Western Europe
Vision Disability
Vision Disability Comparison
Bulgarians
Immigrants from Western Europe
1.9%
VISION DISABILITY
99.9/ 100
METRIC RATING
25th/ 347
METRIC RANK
2.2%
VISION DISABILITY
41.1/ 100
METRIC RATING
181st/ 347
METRIC RANK
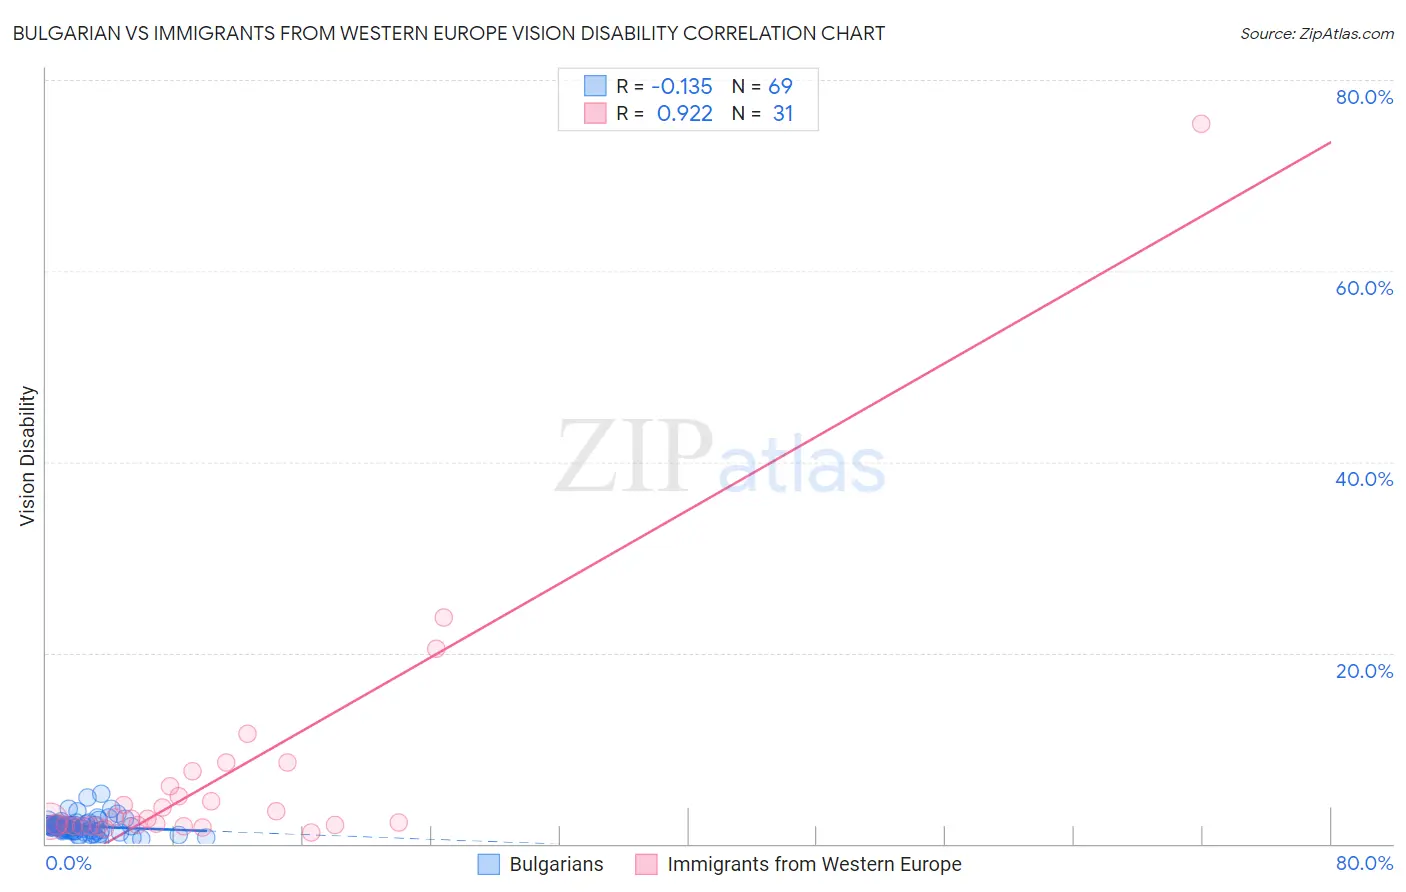
Bulgarian vs Immigrants from Western Europe Vision Disability Correlation Chart
The statistical analysis conducted on geographies consisting of 205,563,576 people shows a poor negative correlation between the proportion of Bulgarians and percentage of population with vision disability in the United States with a correlation coefficient (R) of -0.135 and weighted average of 1.9%. Similarly, the statistical analysis conducted on geographies consisting of 493,396,041 people shows a near-perfect positive correlation between the proportion of Immigrants from Western Europe and percentage of population with vision disability in the United States with a correlation coefficient (R) of 0.922 and weighted average of 2.2%, a difference of 13.4%.
Vision Disability Correlation Summary
| Measurement | Bulgarian | Immigrants from Western Europe |
| Minimum | 0.26% | 1.2% |
| Maximum | 5.2% | 75.4% |
| Range | 4.9% | 74.2% |
| Mean | 1.8% | 7.0% |
| Median | 1.8% | 2.6% |
| Interquartile 25% (IQ1) | 1.3% | 1.9% |
| Interquartile 75% (IQ3) | 2.0% | 6.1% |
| Interquartile Range (IQR) | 0.69% | 4.2% |
| Standard Deviation (Sample) | 0.87% | 13.7% |
| Standard Deviation (Population) | 0.86% | 13.5% |
Similar Demographics by Vision Disability
Demographics Similar to Bulgarians by Vision Disability
In terms of vision disability, the demographic groups most similar to Bulgarians are Immigrants from Lithuania (1.9%, a difference of 0.040%), Immigrants from Japan (1.9%, a difference of 0.040%), Immigrants from Asia (1.9%, a difference of 0.16%), Taiwanese (1.9%, a difference of 0.37%), and Immigrants from Malaysia (1.9%, a difference of 0.40%).
| Demographics | Rating | Rank | Vision Disability |
| Bolivians | 100.0 /100 | #18 | Exceptional 1.9% |
| Immigrants | Sri Lanka | 100.0 /100 | #19 | Exceptional 1.9% |
| Asians | 100.0 /100 | #20 | Exceptional 1.9% |
| Turks | 100.0 /100 | #21 | Exceptional 1.9% |
| Immigrants | Pakistan | 100.0 /100 | #22 | Exceptional 1.9% |
| Immigrants | Asia | 99.9 /100 | #23 | Exceptional 1.9% |
| Immigrants | Lithuania | 99.9 /100 | #24 | Exceptional 1.9% |
| Bulgarians | 99.9 /100 | #25 | Exceptional 1.9% |
| Immigrants | Japan | 99.9 /100 | #26 | Exceptional 1.9% |
| Taiwanese | 99.9 /100 | #27 | Exceptional 1.9% |
| Immigrants | Malaysia | 99.9 /100 | #28 | Exceptional 1.9% |
| Egyptians | 99.9 /100 | #29 | Exceptional 1.9% |
| Immigrants | Nepal | 99.9 /100 | #30 | Exceptional 1.9% |
| Mongolians | 99.9 /100 | #31 | Exceptional 1.9% |
| Luxembourgers | 99.9 /100 | #32 | Exceptional 1.9% |
Demographics Similar to Immigrants from Western Europe by Vision Disability
In terms of vision disability, the demographic groups most similar to Immigrants from Western Europe are Costa Rican (2.2%, a difference of 0.020%), Uruguayan (2.2%, a difference of 0.10%), Immigrants from Burma/Myanmar (2.2%, a difference of 0.21%), Immigrants from North America (2.2%, a difference of 0.22%), and Immigrants from Oceania (2.2%, a difference of 0.26%).
| Demographics | Rating | Rank | Vision Disability |
| Immigrants | Canada | 50.0 /100 | #174 | Average 2.2% |
| Immigrants | Fiji | 47.6 /100 | #175 | Average 2.2% |
| Yugoslavians | 46.5 /100 | #176 | Average 2.2% |
| Slavs | 46.0 /100 | #177 | Average 2.2% |
| Immigrants | Oceania | 45.1 /100 | #178 | Average 2.2% |
| Immigrants | North America | 44.5 /100 | #179 | Average 2.2% |
| Uruguayans | 42.7 /100 | #180 | Average 2.2% |
| Immigrants | Western Europe | 41.1 /100 | #181 | Average 2.2% |
| Costa Ricans | 40.7 /100 | #182 | Average 2.2% |
| Immigrants | Burma/Myanmar | 37.9 /100 | #183 | Fair 2.2% |
| Moroccans | 35.4 /100 | #184 | Fair 2.2% |
| Immigrants | Middle Africa | 33.5 /100 | #185 | Fair 2.2% |
| Native Hawaiians | 33.3 /100 | #186 | Fair 2.2% |
| Immigrants | St. Vincent and the Grenadines | 30.3 /100 | #187 | Fair 2.2% |
| Guyanese | 28.9 /100 | #188 | Fair 2.2% |