Portuguese vs Immigrants from Barbados Vision Disability
COMPARE
Portuguese
Immigrants from Barbados
Vision Disability
Vision Disability Comparison
Portuguese
Immigrants from Barbados
2.3%
VISION DISABILITY
4.9/ 100
METRIC RATING
218th/ 347
METRIC RANK
2.2%
VISION DISABILITY
24.0/ 100
METRIC RATING
194th/ 347
METRIC RANK
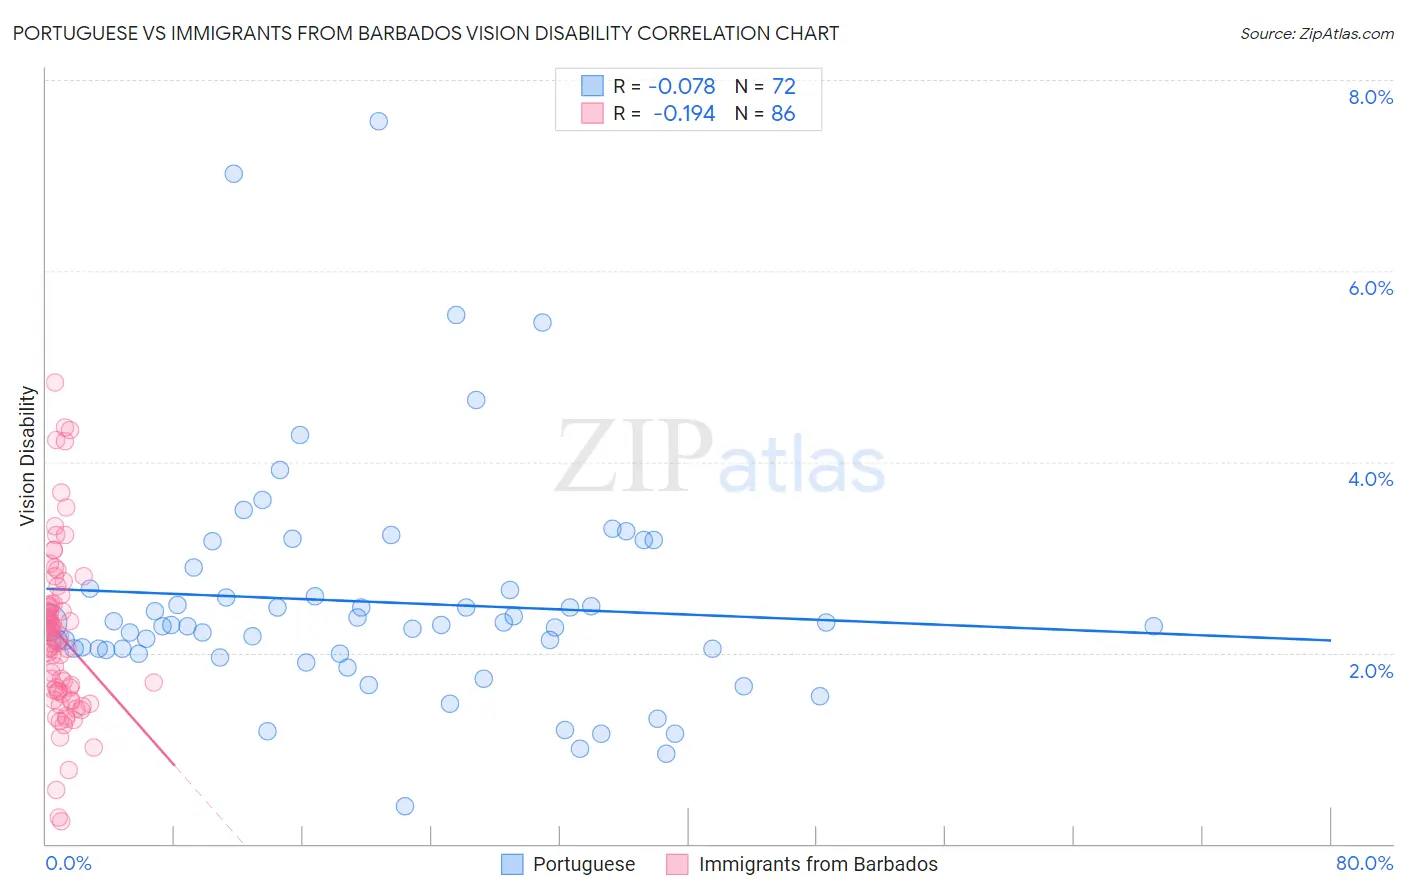
Portuguese vs Immigrants from Barbados Vision Disability Correlation Chart
The statistical analysis conducted on geographies consisting of 449,734,569 people shows a slight negative correlation between the proportion of Portuguese and percentage of population with vision disability in the United States with a correlation coefficient (R) of -0.078 and weighted average of 2.3%. Similarly, the statistical analysis conducted on geographies consisting of 112,772,018 people shows a poor negative correlation between the proportion of Immigrants from Barbados and percentage of population with vision disability in the United States with a correlation coefficient (R) of -0.194 and weighted average of 2.2%, a difference of 2.8%.
Vision Disability Correlation Summary
| Measurement | Portuguese | Immigrants from Barbados |
| Minimum | 0.39% | 0.23% |
| Maximum | 7.6% | 4.8% |
| Range | 7.2% | 4.6% |
| Mean | 2.5% | 2.2% |
| Median | 2.3% | 2.2% |
| Interquartile 25% (IQ1) | 2.0% | 1.6% |
| Interquartile 75% (IQ3) | 2.7% | 2.5% |
| Interquartile Range (IQR) | 0.65% | 0.91% |
| Standard Deviation (Sample) | 1.2% | 0.87% |
| Standard Deviation (Population) | 1.2% | 0.87% |
Similar Demographics by Vision Disability
Demographics Similar to Portuguese by Vision Disability
In terms of vision disability, the demographic groups most similar to Portuguese are Barbadian (2.3%, a difference of 0.070%), Ecuadorian (2.3%, a difference of 0.11%), Immigrants from Trinidad and Tobago (2.3%, a difference of 0.34%), Guamanian/Chamorro (2.3%, a difference of 0.35%), and French Canadian (2.3%, a difference of 0.36%).
| Demographics | Rating | Rank | Vision Disability |
| Indonesians | 9.5 /100 | #211 | Tragic 2.2% |
| Bermudans | 9.0 /100 | #212 | Tragic 2.2% |
| Immigrants | Ghana | 8.9 /100 | #213 | Tragic 2.2% |
| Trinidadians and Tobagonians | 8.2 /100 | #214 | Tragic 2.2% |
| Nigerians | 7.2 /100 | #215 | Tragic 2.3% |
| Immigrants | Trinidad and Tobago | 6.1 /100 | #216 | Tragic 2.3% |
| Barbadians | 5.1 /100 | #217 | Tragic 2.3% |
| Portuguese | 4.9 /100 | #218 | Tragic 2.3% |
| Ecuadorians | 4.6 /100 | #219 | Tragic 2.3% |
| Guamanians/Chamorros | 3.9 /100 | #220 | Tragic 2.3% |
| French Canadians | 3.9 /100 | #221 | Tragic 2.3% |
| Immigrants | Senegal | 3.8 /100 | #222 | Tragic 2.3% |
| Basques | 3.5 /100 | #223 | Tragic 2.3% |
| Irish | 3.4 /100 | #224 | Tragic 2.3% |
| Immigrants | Western Africa | 3.4 /100 | #225 | Tragic 2.3% |
Demographics Similar to Immigrants from Barbados by Vision Disability
In terms of vision disability, the demographic groups most similar to Immigrants from Barbados are Immigrants (2.2%, a difference of 0.020%), Immigrants from Grenada (2.2%, a difference of 0.070%), British (2.2%, a difference of 0.090%), Canadian (2.2%, a difference of 0.15%), and European (2.2%, a difference of 0.15%).
| Demographics | Rating | Rank | Vision Disability |
| Immigrants | St. Vincent and the Grenadines | 30.3 /100 | #187 | Fair 2.2% |
| Guyanese | 28.9 /100 | #188 | Fair 2.2% |
| Salvadorans | 27.4 /100 | #189 | Fair 2.2% |
| Immigrants | Costa Rica | 26.1 /100 | #190 | Fair 2.2% |
| Canadians | 25.8 /100 | #191 | Fair 2.2% |
| Europeans | 25.7 /100 | #192 | Fair 2.2% |
| British | 25.1 /100 | #193 | Fair 2.2% |
| Immigrants | Barbados | 24.0 /100 | #194 | Fair 2.2% |
| Immigrants | Immigrants | 23.7 /100 | #195 | Fair 2.2% |
| Immigrants | Grenada | 23.1 /100 | #196 | Fair 2.2% |
| Ghanaians | 21.8 /100 | #197 | Fair 2.2% |
| Czechoslovakians | 21.6 /100 | #198 | Fair 2.2% |
| Immigrants | El Salvador | 21.0 /100 | #199 | Fair 2.2% |
| Immigrants | Thailand | 20.1 /100 | #200 | Fair 2.2% |
| Slovaks | 18.8 /100 | #201 | Poor 2.2% |