Bulgarian vs Bahamian Disability Age 5 to 17
COMPARE
Bulgarian
Bahamian
Disability Age 5 to 17
Disability Age 5 to 17 Comparison
Bulgarians
Bahamians
5.2%
DISABILITY AGE 5 TO 17
99.4/ 100
METRIC RATING
85th/ 347
METRIC RANK
6.3%
DISABILITY AGE 5 TO 17
0.0/ 100
METRIC RATING
307th/ 347
METRIC RANK
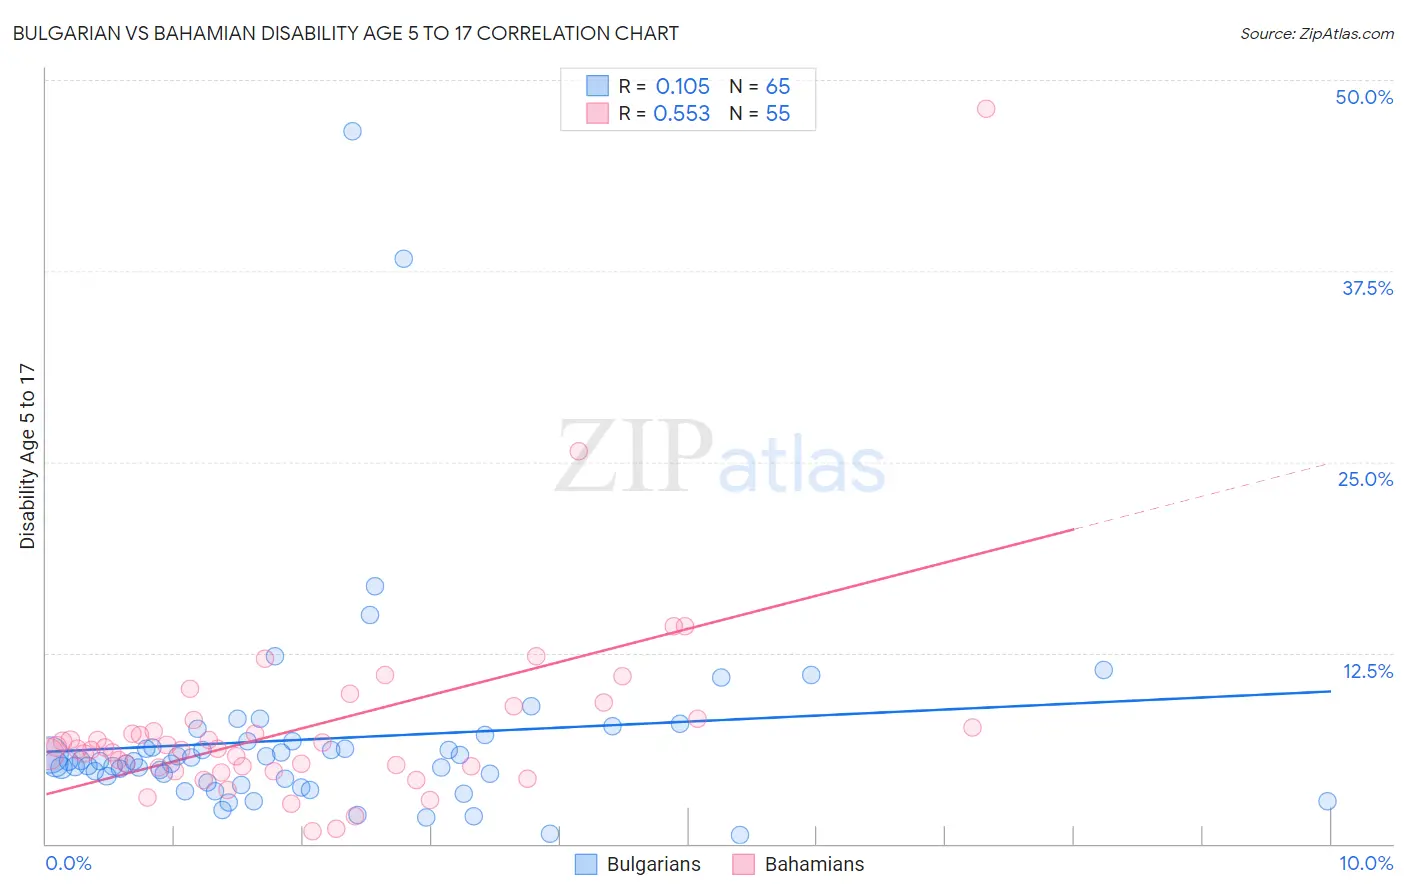
Bulgarian vs Bahamian Disability Age 5 to 17 Correlation Chart
The statistical analysis conducted on geographies consisting of 204,463,021 people shows a poor positive correlation between the proportion of Bulgarians and percentage of population with a disability between the ages 5 and 17 in the United States with a correlation coefficient (R) of 0.105 and weighted average of 5.2%. Similarly, the statistical analysis conducted on geographies consisting of 112,302,406 people shows a substantial positive correlation between the proportion of Bahamians and percentage of population with a disability between the ages 5 and 17 in the United States with a correlation coefficient (R) of 0.553 and weighted average of 6.3%, a difference of 20.6%.
Disability Age 5 to 17 Correlation Summary
| Measurement | Bulgarian | Bahamian |
| Minimum | 0.57% | 0.80% |
| Maximum | 46.7% | 48.1% |
| Range | 46.1% | 47.4% |
| Mean | 6.9% | 7.6% |
| Median | 5.4% | 6.2% |
| Interquartile 25% (IQ1) | 4.1% | 5.0% |
| Interquartile 75% (IQ3) | 6.7% | 8.1% |
| Interquartile Range (IQR) | 2.6% | 3.1% |
| Standard Deviation (Sample) | 7.1% | 6.8% |
| Standard Deviation (Population) | 7.0% | 6.7% |
Similar Demographics by Disability Age 5 to 17
Demographics Similar to Bulgarians by Disability Age 5 to 17
In terms of disability age 5 to 17, the demographic groups most similar to Bulgarians are Immigrants from St. Vincent and the Grenadines (5.2%, a difference of 0.040%), Immigrants from Nicaragua (5.2%, a difference of 0.070%), Eastern European (5.2%, a difference of 0.080%), Immigrants from Croatia (5.2%, a difference of 0.12%), and Immigrants from Spain (5.2%, a difference of 0.12%).
| Demographics | Rating | Rank | Disability Age 5 to 17 |
| Immigrants | Cuba | 99.6 /100 | #78 | Exceptional 5.2% |
| Afghans | 99.6 /100 | #79 | Exceptional 5.2% |
| Sri Lankans | 99.6 /100 | #80 | Exceptional 5.2% |
| Native Hawaiians | 99.6 /100 | #81 | Exceptional 5.2% |
| Immigrants | Sweden | 99.5 /100 | #82 | Exceptional 5.2% |
| Immigrants | France | 99.5 /100 | #83 | Exceptional 5.2% |
| Immigrants | Nicaragua | 99.5 /100 | #84 | Exceptional 5.2% |
| Bulgarians | 99.4 /100 | #85 | Exceptional 5.2% |
| Immigrants | St. Vincent and the Grenadines | 99.4 /100 | #86 | Exceptional 5.2% |
| Eastern Europeans | 99.4 /100 | #87 | Exceptional 5.2% |
| Immigrants | Croatia | 99.4 /100 | #88 | Exceptional 5.2% |
| Immigrants | Spain | 99.4 /100 | #89 | Exceptional 5.2% |
| Immigrants | Kuwait | 99.4 /100 | #90 | Exceptional 5.3% |
| Mongolians | 99.2 /100 | #91 | Exceptional 5.3% |
| Luxembourgers | 99.2 /100 | #92 | Exceptional 5.3% |
Demographics Similar to Bahamians by Disability Age 5 to 17
In terms of disability age 5 to 17, the demographic groups most similar to Bahamians are Nonimmigrants (6.3%, a difference of 0.14%), Scotch-Irish (6.3%, a difference of 0.23%), Native/Alaskan (6.3%, a difference of 0.24%), Hmong (6.3%, a difference of 0.26%), and Senegalese (6.3%, a difference of 0.38%).
| Demographics | Rating | Rank | Disability Age 5 to 17 |
| Carpatho Rusyns | 0.0 /100 | #300 | Tragic 6.3% |
| U.S. Virgin Islanders | 0.0 /100 | #301 | Tragic 6.3% |
| Celtics | 0.0 /100 | #302 | Tragic 6.3% |
| Yakama | 0.0 /100 | #303 | Tragic 6.3% |
| Senegalese | 0.0 /100 | #304 | Tragic 6.3% |
| Natives/Alaskans | 0.0 /100 | #305 | Tragic 6.3% |
| Immigrants | Nonimmigrants | 0.0 /100 | #306 | Tragic 6.3% |
| Bahamians | 0.0 /100 | #307 | Tragic 6.3% |
| Scotch-Irish | 0.0 /100 | #308 | Tragic 6.3% |
| Hmong | 0.0 /100 | #309 | Tragic 6.3% |
| Alaskan Athabascans | 0.0 /100 | #310 | Tragic 6.3% |
| Immigrants | Dominica | 0.0 /100 | #311 | Tragic 6.3% |
| Bermudans | 0.0 /100 | #312 | Tragic 6.4% |
| Apache | 0.0 /100 | #313 | Tragic 6.4% |
| French | 0.0 /100 | #314 | Tragic 6.4% |