Bulgarian vs Bahamian Median Female Earnings
COMPARE
Bulgarian
Bahamian
Median Female Earnings
Median Female Earnings Comparison
Bulgarians
Bahamians
$43,638
MEDIAN FEMALE EARNINGS
100.0/ 100
METRIC RATING
43rd/ 347
METRIC RANK
$35,125
MEDIAN FEMALE EARNINGS
0.0/ 100
METRIC RATING
305th/ 347
METRIC RANK
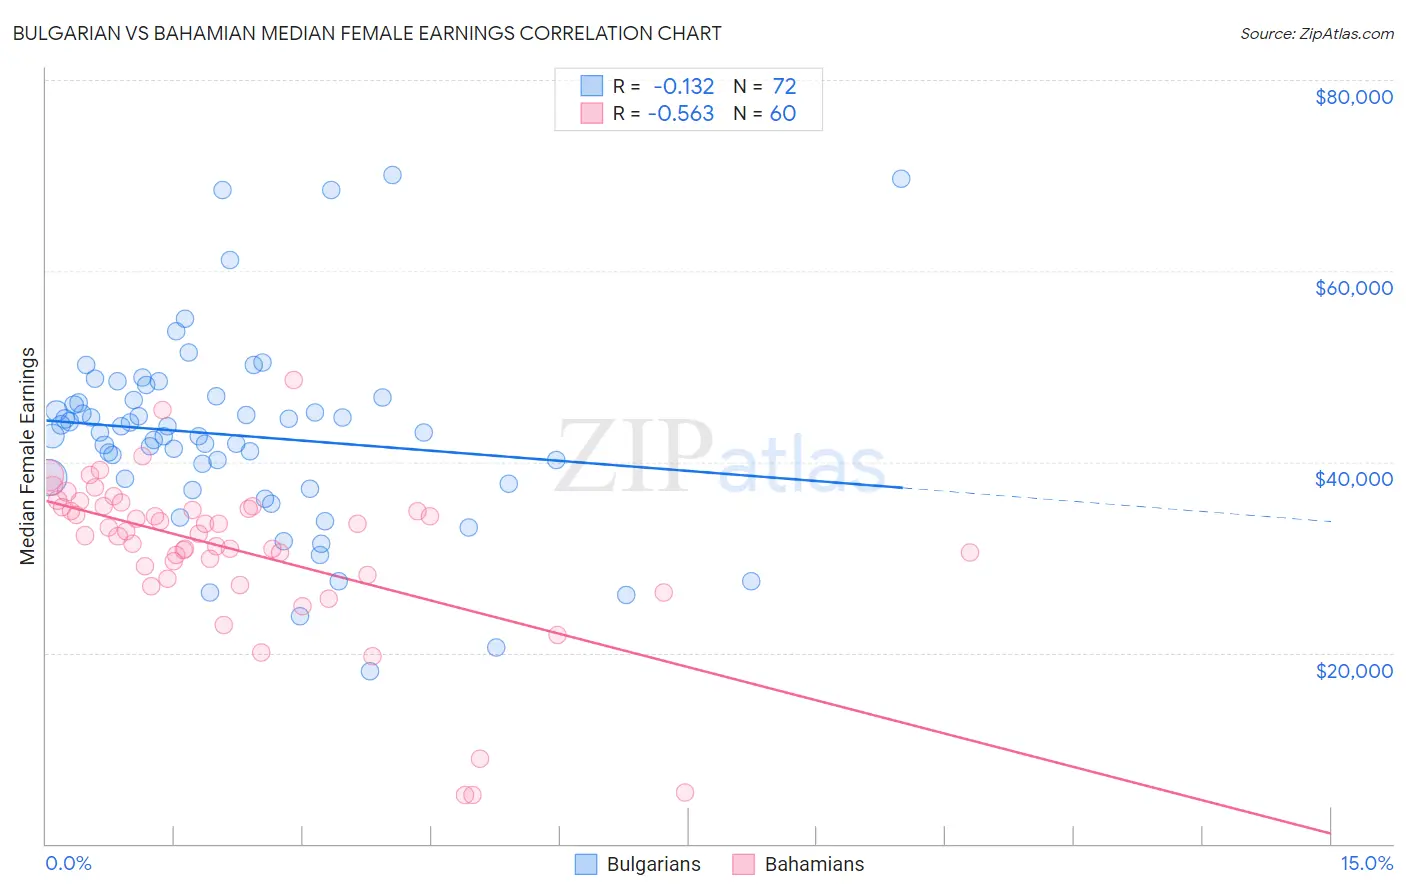
Bulgarian vs Bahamian Median Female Earnings Correlation Chart
The statistical analysis conducted on geographies consisting of 205,601,132 people shows a poor negative correlation between the proportion of Bulgarians and median female earnings in the United States with a correlation coefficient (R) of -0.132 and weighted average of $43,638. Similarly, the statistical analysis conducted on geographies consisting of 112,672,199 people shows a substantial negative correlation between the proportion of Bahamians and median female earnings in the United States with a correlation coefficient (R) of -0.563 and weighted average of $35,125, a difference of 24.2%.
Median Female Earnings Correlation Summary
| Measurement | Bulgarian | Bahamian |
| Minimum | $18,066 | $5,063 |
| Maximum | $70,060 | $48,590 |
| Range | $51,994 | $43,527 |
| Mean | $42,770 | $30,808 |
| Median | $43,122 | $32,617 |
| Interquartile 25% (IQ1) | $37,998 | $28,645 |
| Interquartile 75% (IQ3) | $46,606 | $35,290 |
| Interquartile Range (IQR) | $8,608 | $6,645 |
| Standard Deviation (Sample) | $10,148 | $8,476 |
| Standard Deviation (Population) | $10,078 | $8,405 |
Similar Demographics by Median Female Earnings
Demographics Similar to Bulgarians by Median Female Earnings
In terms of median female earnings, the demographic groups most similar to Bulgarians are Bhutanese ($43,648, a difference of 0.020%), Immigrants from Denmark ($43,646, a difference of 0.020%), Immigrants from Czechoslovakia ($43,571, a difference of 0.15%), Immigrants from Europe ($43,523, a difference of 0.26%), and Immigrants from Bolivia ($43,467, a difference of 0.39%).
| Demographics | Rating | Rank | Median Female Earnings |
| Immigrants | Turkey | 100.0 /100 | #36 | Exceptional $44,066 |
| Immigrants | Switzerland | 100.0 /100 | #37 | Exceptional $43,996 |
| Latvians | 100.0 /100 | #38 | Exceptional $43,941 |
| Israelis | 100.0 /100 | #39 | Exceptional $43,852 |
| Immigrants | Malaysia | 100.0 /100 | #40 | Exceptional $43,835 |
| Bhutanese | 100.0 /100 | #41 | Exceptional $43,648 |
| Immigrants | Denmark | 100.0 /100 | #42 | Exceptional $43,646 |
| Bulgarians | 100.0 /100 | #43 | Exceptional $43,638 |
| Immigrants | Czechoslovakia | 100.0 /100 | #44 | Exceptional $43,571 |
| Immigrants | Europe | 100.0 /100 | #45 | Exceptional $43,523 |
| Immigrants | Bolivia | 100.0 /100 | #46 | Exceptional $43,467 |
| Bolivians | 100.0 /100 | #47 | Exceptional $43,445 |
| Immigrants | Indonesia | 100.0 /100 | #48 | Exceptional $43,412 |
| Immigrants | Serbia | 100.0 /100 | #49 | Exceptional $43,385 |
| Immigrants | Uzbekistan | 100.0 /100 | #50 | Exceptional $43,363 |
Demographics Similar to Bahamians by Median Female Earnings
In terms of median female earnings, the demographic groups most similar to Bahamians are Fijian ($35,114, a difference of 0.030%), Sioux ($35,063, a difference of 0.18%), Immigrants from Bahamas ($35,027, a difference of 0.28%), Honduran ($35,013, a difference of 0.32%), and Chippewa ($35,003, a difference of 0.35%).
| Demographics | Rating | Rank | Median Female Earnings |
| Immigrants | Micronesia | 0.0 /100 | #298 | Tragic $35,477 |
| Immigrants | Guatemala | 0.0 /100 | #299 | Tragic $35,444 |
| Yuman | 0.0 /100 | #300 | Tragic $35,377 |
| Pima | 0.0 /100 | #301 | Tragic $35,326 |
| Blacks/African Americans | 0.0 /100 | #302 | Tragic $35,315 |
| Immigrants | Latin America | 0.0 /100 | #303 | Tragic $35,307 |
| Crow | 0.0 /100 | #304 | Tragic $35,266 |
| Bahamians | 0.0 /100 | #305 | Tragic $35,125 |
| Fijians | 0.0 /100 | #306 | Tragic $35,114 |
| Sioux | 0.0 /100 | #307 | Tragic $35,063 |
| Immigrants | Bahamas | 0.0 /100 | #308 | Tragic $35,027 |
| Hondurans | 0.0 /100 | #309 | Tragic $35,013 |
| Chippewa | 0.0 /100 | #310 | Tragic $35,003 |
| Ute | 0.0 /100 | #311 | Tragic $34,960 |
| Yaqui | 0.0 /100 | #312 | Tragic $34,943 |