Guyanese vs Cheyenne Female Disability
COMPARE
Guyanese
Cheyenne
Female Disability
Female Disability Comparison
Guyanese
Cheyenne
12.1%
FEMALE DISABILITY
64.7/ 100
METRIC RATING
161st/ 347
METRIC RANK
13.0%
FEMALE DISABILITY
0.1/ 100
METRIC RATING
275th/ 347
METRIC RANK
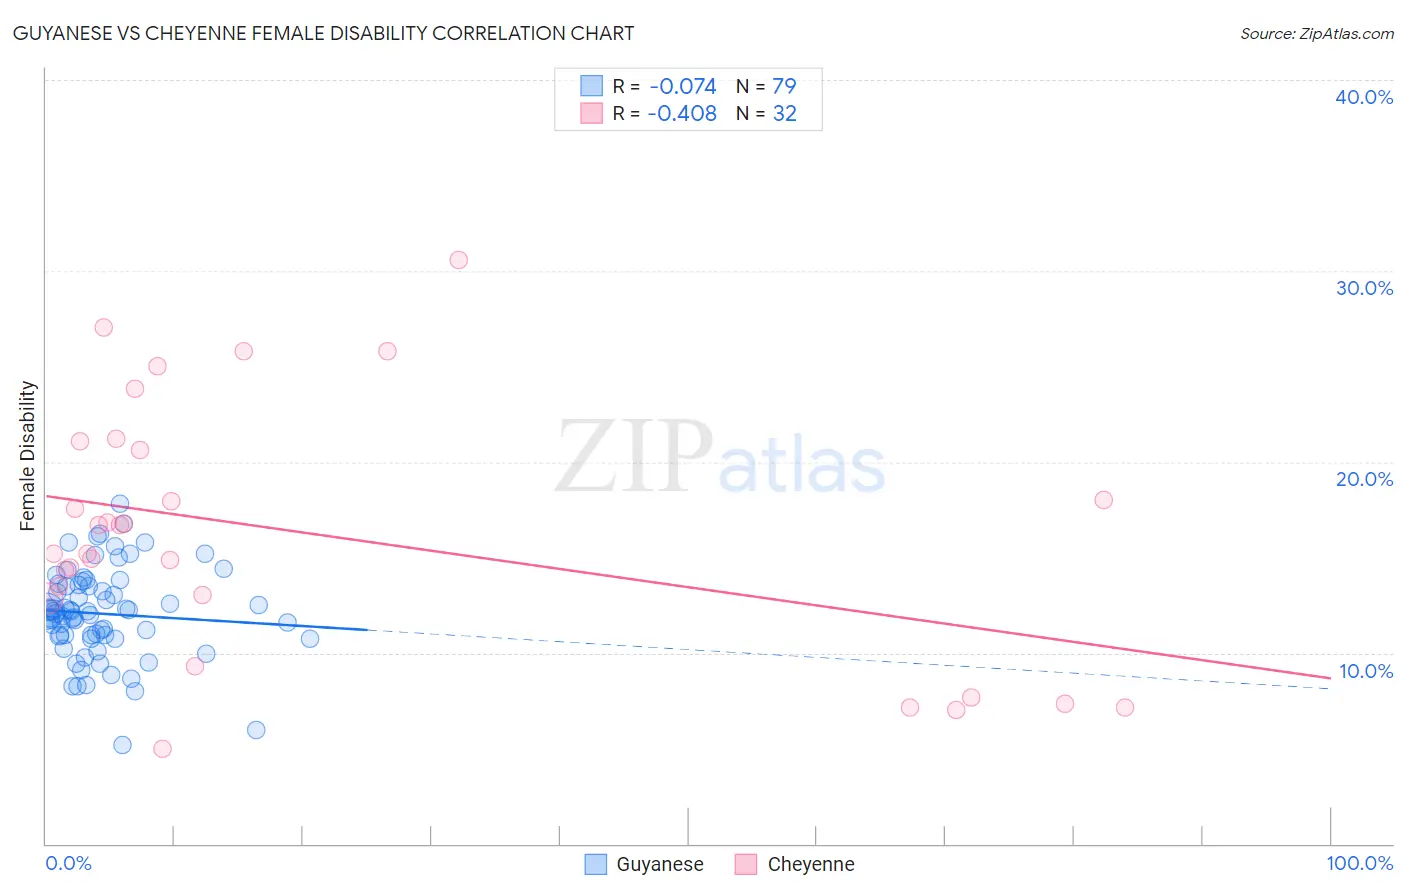
Guyanese vs Cheyenne Female Disability Correlation Chart
The statistical analysis conducted on geographies consisting of 176,903,596 people shows a slight negative correlation between the proportion of Guyanese and percentage of females with a disability in the United States with a correlation coefficient (R) of -0.074 and weighted average of 12.1%. Similarly, the statistical analysis conducted on geographies consisting of 80,710,076 people shows a moderate negative correlation between the proportion of Cheyenne and percentage of females with a disability in the United States with a correlation coefficient (R) of -0.408 and weighted average of 13.0%, a difference of 7.0%.
Female Disability Correlation Summary
| Measurement | Guyanese | Cheyenne |
| Minimum | 5.2% | 5.0% |
| Maximum | 17.8% | 30.6% |
| Range | 12.6% | 25.6% |
| Mean | 12.0% | 16.3% |
| Median | 12.2% | 16.0% |
| Interquartile 25% (IQ1) | 10.8% | 12.9% |
| Interquartile 75% (IQ3) | 13.5% | 20.9% |
| Interquartile Range (IQR) | 2.7% | 7.9% |
| Standard Deviation (Sample) | 2.4% | 6.6% |
| Standard Deviation (Population) | 2.4% | 6.5% |
Similar Demographics by Female Disability
Demographics Similar to Guyanese by Female Disability
In terms of female disability, the demographic groups most similar to Guyanese are Immigrants from Ukraine (12.1%, a difference of 0.010%), Guatemalan (12.1%, a difference of 0.030%), Czech (12.1%, a difference of 0.040%), Immigrants from Guatemala (12.1%, a difference of 0.060%), and Immigrants from Oceania (12.1%, a difference of 0.11%).
| Demographics | Rating | Rank | Female Disability |
| Syrians | 76.9 /100 | #154 | Good 12.1% |
| Ghanaians | 76.6 /100 | #155 | Good 12.1% |
| Moroccans | 72.9 /100 | #156 | Good 12.1% |
| Danes | 72.5 /100 | #157 | Good 12.1% |
| Immigrants | Middle Africa | 72.4 /100 | #158 | Good 12.1% |
| Immigrants | Central America | 67.7 /100 | #159 | Good 12.1% |
| Immigrants | Guatemala | 66.0 /100 | #160 | Good 12.1% |
| Guyanese | 64.7 /100 | #161 | Good 12.1% |
| Immigrants | Ukraine | 64.3 /100 | #162 | Good 12.1% |
| Guatemalans | 63.8 /100 | #163 | Good 12.1% |
| Czechs | 63.6 /100 | #164 | Good 12.1% |
| Immigrants | Oceania | 61.8 /100 | #165 | Good 12.1% |
| Lithuanians | 59.5 /100 | #166 | Average 12.2% |
| Immigrants | Latin America | 59.0 /100 | #167 | Average 12.2% |
| Immigrants | Haiti | 58.8 /100 | #168 | Average 12.2% |
Demographics Similar to Cheyenne by Female Disability
In terms of female disability, the demographic groups most similar to Cheyenne are Portuguese (13.0%, a difference of 0.050%), Immigrants from Dominica (13.0%, a difference of 0.050%), Sioux (12.9%, a difference of 0.17%), German (12.9%, a difference of 0.19%), and Spanish (13.0%, a difference of 0.25%).
| Demographics | Rating | Rank | Female Disability |
| Immigrants | Laos | 0.4 /100 | #268 | Tragic 12.8% |
| Indonesians | 0.4 /100 | #269 | Tragic 12.8% |
| Immigrants | Liberia | 0.3 /100 | #270 | Tragic 12.9% |
| Dutch | 0.2 /100 | #271 | Tragic 12.9% |
| Germans | 0.1 /100 | #272 | Tragic 12.9% |
| Sioux | 0.1 /100 | #273 | Tragic 12.9% |
| Portuguese | 0.1 /100 | #274 | Tragic 13.0% |
| Cheyenne | 0.1 /100 | #275 | Tragic 13.0% |
| Immigrants | Dominica | 0.1 /100 | #276 | Tragic 13.0% |
| Spanish | 0.1 /100 | #277 | Tragic 13.0% |
| Scottish | 0.1 /100 | #278 | Tragic 13.0% |
| Arapaho | 0.1 /100 | #279 | Tragic 13.0% |
| Irish | 0.1 /100 | #280 | Tragic 13.1% |
| U.S. Virgin Islanders | 0.1 /100 | #281 | Tragic 13.1% |
| Welsh | 0.0 /100 | #282 | Tragic 13.1% |