Brazilian vs Immigrants from Senegal Hearing Disability
COMPARE
Brazilian
Immigrants from Senegal
Hearing Disability
Hearing Disability Comparison
Brazilians
Immigrants from Senegal
2.9%
HEARING DISABILITY
78.7/ 100
METRIC RATING
146th/ 347
METRIC RANK
2.6%
HEARING DISABILITY
99.7/ 100
METRIC RATING
26th/ 347
METRIC RANK
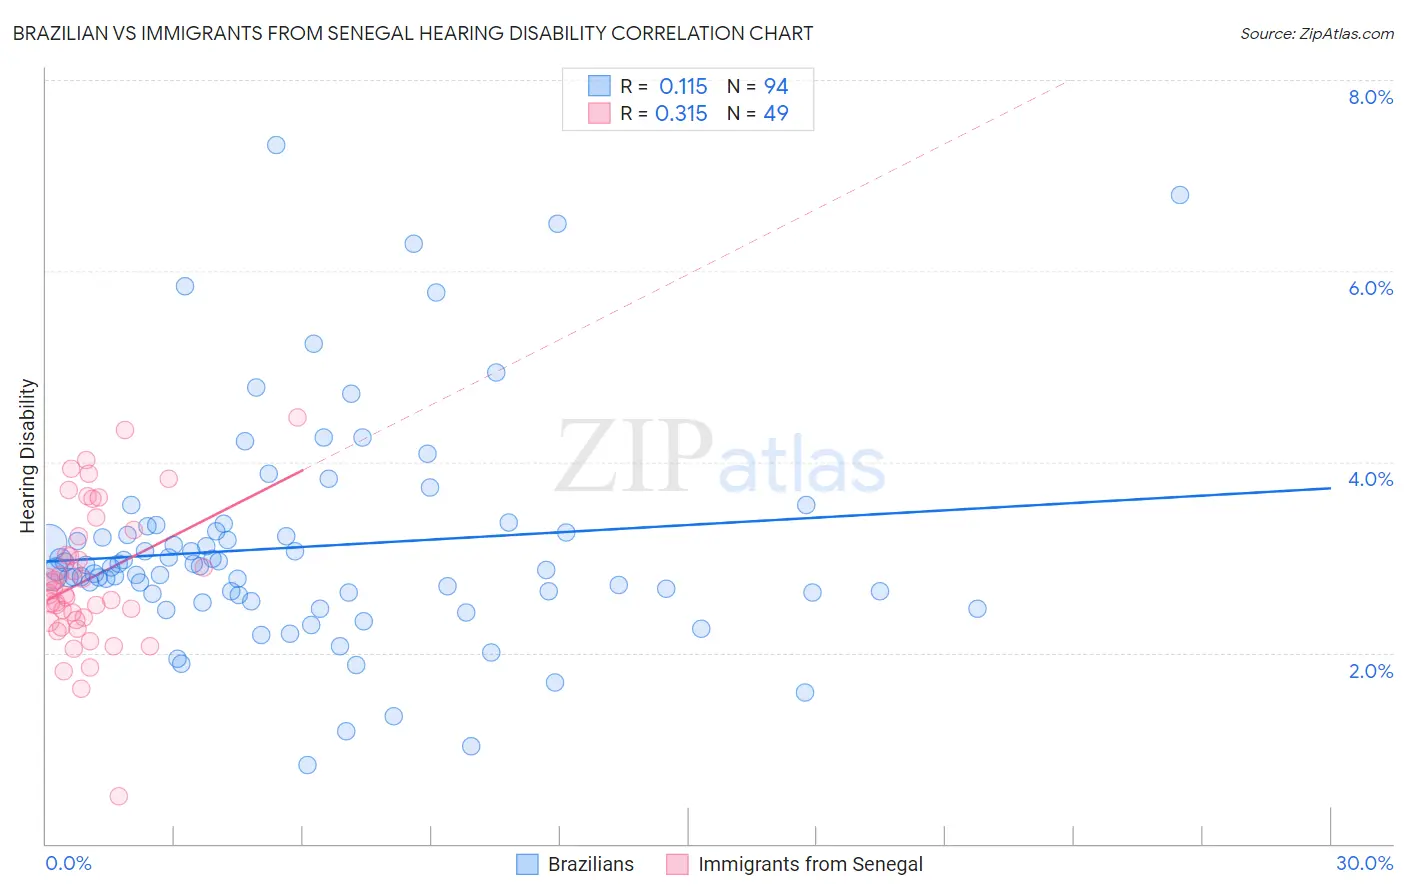
Brazilian vs Immigrants from Senegal Hearing Disability Correlation Chart
The statistical analysis conducted on geographies consisting of 323,867,149 people shows a poor positive correlation between the proportion of Brazilians and percentage of population with hearing disability in the United States with a correlation coefficient (R) of 0.115 and weighted average of 2.9%. Similarly, the statistical analysis conducted on geographies consisting of 90,120,921 people shows a mild positive correlation between the proportion of Immigrants from Senegal and percentage of population with hearing disability in the United States with a correlation coefficient (R) of 0.315 and weighted average of 2.6%, a difference of 12.5%.
Hearing Disability Correlation Summary
| Measurement | Brazilian | Immigrants from Senegal |
| Minimum | 0.82% | 0.50% |
| Maximum | 7.3% | 4.5% |
| Range | 6.5% | 4.0% |
| Mean | 3.1% | 2.8% |
| Median | 2.9% | 2.6% |
| Interquartile 25% (IQ1) | 2.6% | 2.3% |
| Interquartile 75% (IQ3) | 3.3% | 3.3% |
| Interquartile Range (IQR) | 0.65% | 0.92% |
| Standard Deviation (Sample) | 1.2% | 0.75% |
| Standard Deviation (Population) | 1.2% | 0.74% |
Similar Demographics by Hearing Disability
Demographics Similar to Brazilians by Hearing Disability
In terms of hearing disability, the demographic groups most similar to Brazilians are Tongan (2.9%, a difference of 0.010%), Immigrants from Congo (2.9%, a difference of 0.020%), Immigrants from Bulgaria (2.9%, a difference of 0.070%), Immigrants from Russia (2.9%, a difference of 0.15%), and Immigrants from Panama (2.9%, a difference of 0.26%).
| Demographics | Rating | Rank | Hearing Disability |
| Bermudans | 83.8 /100 | #139 | Excellent 2.9% |
| Immigrants | Jordan | 83.7 /100 | #140 | Excellent 2.9% |
| Sub-Saharan Africans | 83.3 /100 | #141 | Excellent 2.9% |
| Laotians | 81.1 /100 | #142 | Excellent 2.9% |
| Immigrants | Bahamas | 80.9 /100 | #143 | Excellent 2.9% |
| Immigrants | Bulgaria | 79.2 /100 | #144 | Good 2.9% |
| Immigrants | Congo | 78.9 /100 | #145 | Good 2.9% |
| Brazilians | 78.7 /100 | #146 | Good 2.9% |
| Tongans | 78.6 /100 | #147 | Good 2.9% |
| Immigrants | Russia | 77.7 /100 | #148 | Good 2.9% |
| Immigrants | Panama | 76.9 /100 | #149 | Good 2.9% |
| Palestinians | 73.6 /100 | #150 | Good 2.9% |
| Immigrants | France | 73.1 /100 | #151 | Good 2.9% |
| Immigrants | Lithuania | 73.0 /100 | #152 | Good 2.9% |
| Sudanese | 72.1 /100 | #153 | Good 2.9% |
Demographics Similar to Immigrants from Senegal by Hearing Disability
In terms of hearing disability, the demographic groups most similar to Immigrants from Senegal are Immigrants from El Salvador (2.6%, a difference of 0.010%), Immigrants from South Central Asia (2.6%, a difference of 0.040%), Immigrants from Ghana (2.6%, a difference of 0.41%), Immigrants from Haiti (2.6%, a difference of 0.41%), and Bolivian (2.6%, a difference of 0.43%).
| Demographics | Rating | Rank | Hearing Disability |
| Thais | 99.8 /100 | #19 | Exceptional 2.5% |
| Immigrants | Bolivia | 99.8 /100 | #20 | Exceptional 2.5% |
| Ghanaians | 99.8 /100 | #21 | Exceptional 2.5% |
| Immigrants | Sierra Leone | 99.8 /100 | #22 | Exceptional 2.6% |
| Immigrants | Nigeria | 99.8 /100 | #23 | Exceptional 2.6% |
| Immigrants | Ghana | 99.8 /100 | #24 | Exceptional 2.6% |
| Immigrants | El Salvador | 99.7 /100 | #25 | Exceptional 2.6% |
| Immigrants | Senegal | 99.7 /100 | #26 | Exceptional 2.6% |
| Immigrants | South Central Asia | 99.7 /100 | #27 | Exceptional 2.6% |
| Immigrants | Haiti | 99.7 /100 | #28 | Exceptional 2.6% |
| Bolivians | 99.7 /100 | #29 | Exceptional 2.6% |
| Immigrants | Caribbean | 99.7 /100 | #30 | Exceptional 2.6% |
| Immigrants | Cameroon | 99.7 /100 | #31 | Exceptional 2.6% |
| Immigrants | Venezuela | 99.7 /100 | #32 | Exceptional 2.6% |
| Filipinos | 99.6 /100 | #33 | Exceptional 2.6% |