Potawatomi vs Latvian Hearing Disability
COMPARE
Potawatomi
Latvian
Hearing Disability
Hearing Disability Comparison
Potawatomi
Latvians
4.1%
HEARING DISABILITY
0.0/ 100
METRIC RATING
326th/ 347
METRIC RANK
3.2%
HEARING DISABILITY
5.1/ 100
METRIC RATING
225th/ 347
METRIC RANK
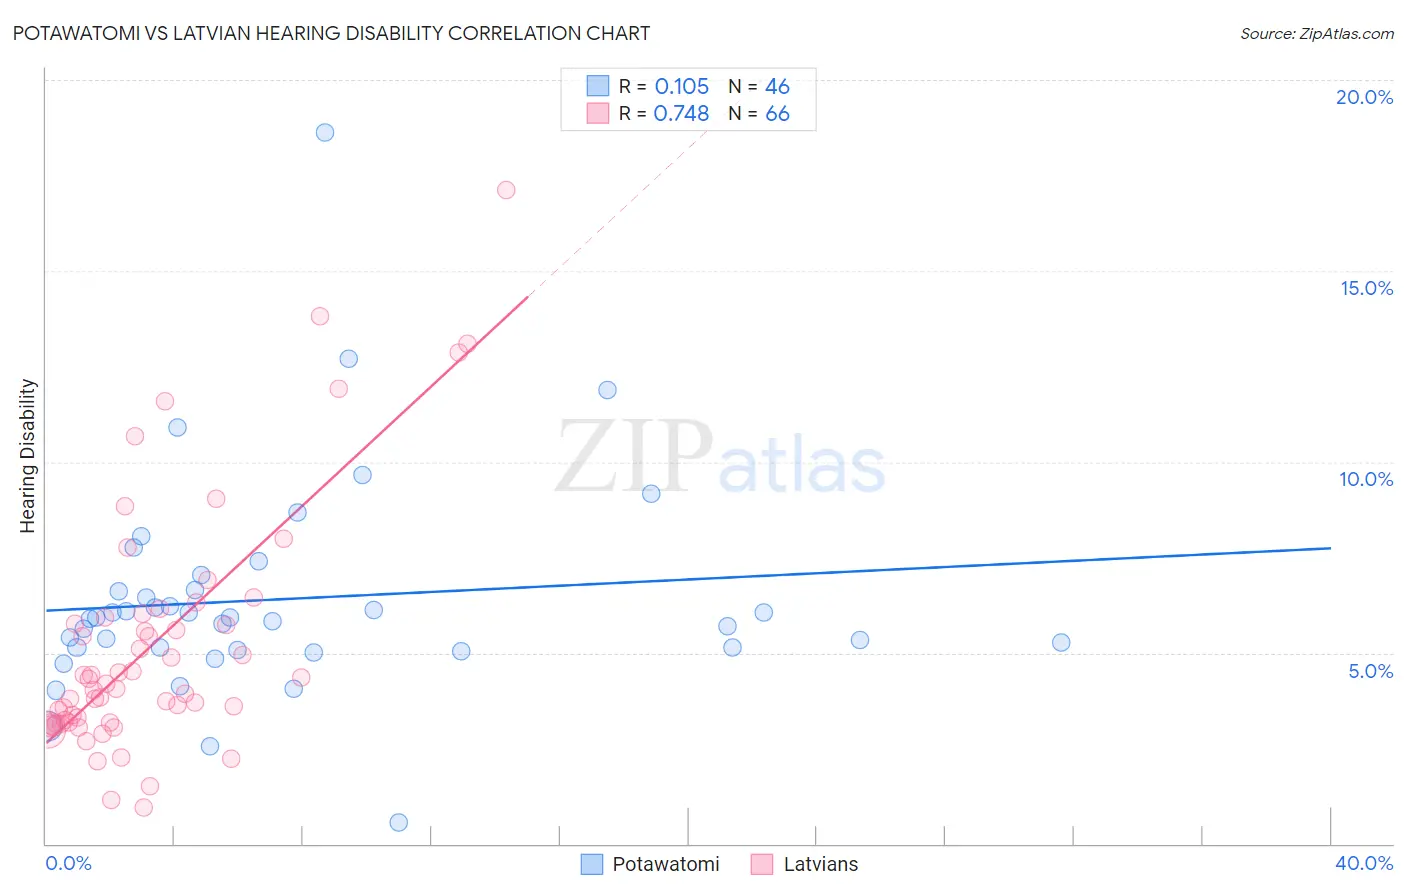
Potawatomi vs Latvian Hearing Disability Correlation Chart
The statistical analysis conducted on geographies consisting of 117,759,395 people shows a poor positive correlation between the proportion of Potawatomi and percentage of population with hearing disability in the United States with a correlation coefficient (R) of 0.105 and weighted average of 4.1%. Similarly, the statistical analysis conducted on geographies consisting of 220,695,390 people shows a strong positive correlation between the proportion of Latvians and percentage of population with hearing disability in the United States with a correlation coefficient (R) of 0.748 and weighted average of 3.2%, a difference of 28.7%.
Hearing Disability Correlation Summary
| Measurement | Potawatomi | Latvian |
| Minimum | 0.55% | 0.95% |
| Maximum | 18.6% | 17.1% |
| Range | 18.1% | 16.2% |
| Mean | 6.4% | 5.2% |
| Median | 5.9% | 4.1% |
| Interquartile 25% (IQ1) | 5.1% | 3.2% |
| Interquartile 75% (IQ3) | 6.6% | 5.9% |
| Interquartile Range (IQR) | 1.5% | 2.8% |
| Standard Deviation (Sample) | 2.9% | 3.2% |
| Standard Deviation (Population) | 2.8% | 3.2% |
Similar Demographics by Hearing Disability
Demographics Similar to Potawatomi by Hearing Disability
In terms of hearing disability, the demographic groups most similar to Potawatomi are Lumbee (4.1%, a difference of 0.29%), Osage (4.1%, a difference of 0.61%), Apache (4.1%, a difference of 0.68%), Arapaho (4.1%, a difference of 0.72%), and Seminole (4.1%, a difference of 0.80%).
| Demographics | Rating | Rank | Hearing Disability |
| Chippewa | 0.0 /100 | #319 | Tragic 4.0% |
| Shoshone | 0.0 /100 | #320 | Tragic 4.0% |
| Paiute | 0.0 /100 | #321 | Tragic 4.1% |
| Seminole | 0.0 /100 | #322 | Tragic 4.1% |
| Apache | 0.0 /100 | #323 | Tragic 4.1% |
| Osage | 0.0 /100 | #324 | Tragic 4.1% |
| Lumbee | 0.0 /100 | #325 | Tragic 4.1% |
| Potawatomi | 0.0 /100 | #326 | Tragic 4.1% |
| Arapaho | 0.0 /100 | #327 | Tragic 4.1% |
| Tohono O'odham | 0.0 /100 | #328 | Tragic 4.2% |
| Crow | 0.0 /100 | #329 | Tragic 4.2% |
| Natives/Alaskans | 0.0 /100 | #330 | Tragic 4.2% |
| Cherokee | 0.0 /100 | #331 | Tragic 4.2% |
| Houma | 0.0 /100 | #332 | Tragic 4.2% |
| Dutch West Indians | 0.0 /100 | #333 | Tragic 4.3% |
Demographics Similar to Latvians by Hearing Disability
In terms of hearing disability, the demographic groups most similar to Latvians are Icelander (3.2%, a difference of 0.040%), Lebanese (3.2%, a difference of 0.040%), Mexican (3.2%, a difference of 0.21%), Bhutanese (3.2%, a difference of 0.23%), and Immigrants from Portugal (3.2%, a difference of 0.42%).
| Demographics | Rating | Rank | Hearing Disability |
| Immigrants | Northern Europe | 7.0 /100 | #218 | Tragic 3.2% |
| New Zealanders | 6.8 /100 | #219 | Tragic 3.2% |
| Malaysians | 6.6 /100 | #220 | Tragic 3.2% |
| Immigrants | Laos | 6.6 /100 | #221 | Tragic 3.2% |
| Immigrants | Oceania | 6.5 /100 | #222 | Tragic 3.2% |
| Mexicans | 5.6 /100 | #223 | Tragic 3.2% |
| Icelanders | 5.2 /100 | #224 | Tragic 3.2% |
| Latvians | 5.1 /100 | #225 | Tragic 3.2% |
| Lebanese | 5.0 /100 | #226 | Tragic 3.2% |
| Bhutanese | 4.6 /100 | #227 | Tragic 3.2% |
| Immigrants | Portugal | 4.3 /100 | #228 | Tragic 3.2% |
| Maltese | 4.1 /100 | #229 | Tragic 3.2% |
| Greeks | 3.2 /100 | #230 | Tragic 3.2% |
| Luxembourgers | 2.9 /100 | #231 | Tragic 3.2% |
| Ukrainians | 2.9 /100 | #232 | Tragic 3.2% |