Delaware vs Latvian Hearing Disability
COMPARE
Delaware
Latvian
Hearing Disability
Hearing Disability Comparison
Delaware
Latvians
3.6%
HEARING DISABILITY
0.0/ 100
METRIC RATING
286th/ 347
METRIC RANK
3.2%
HEARING DISABILITY
5.1/ 100
METRIC RATING
225th/ 347
METRIC RANK
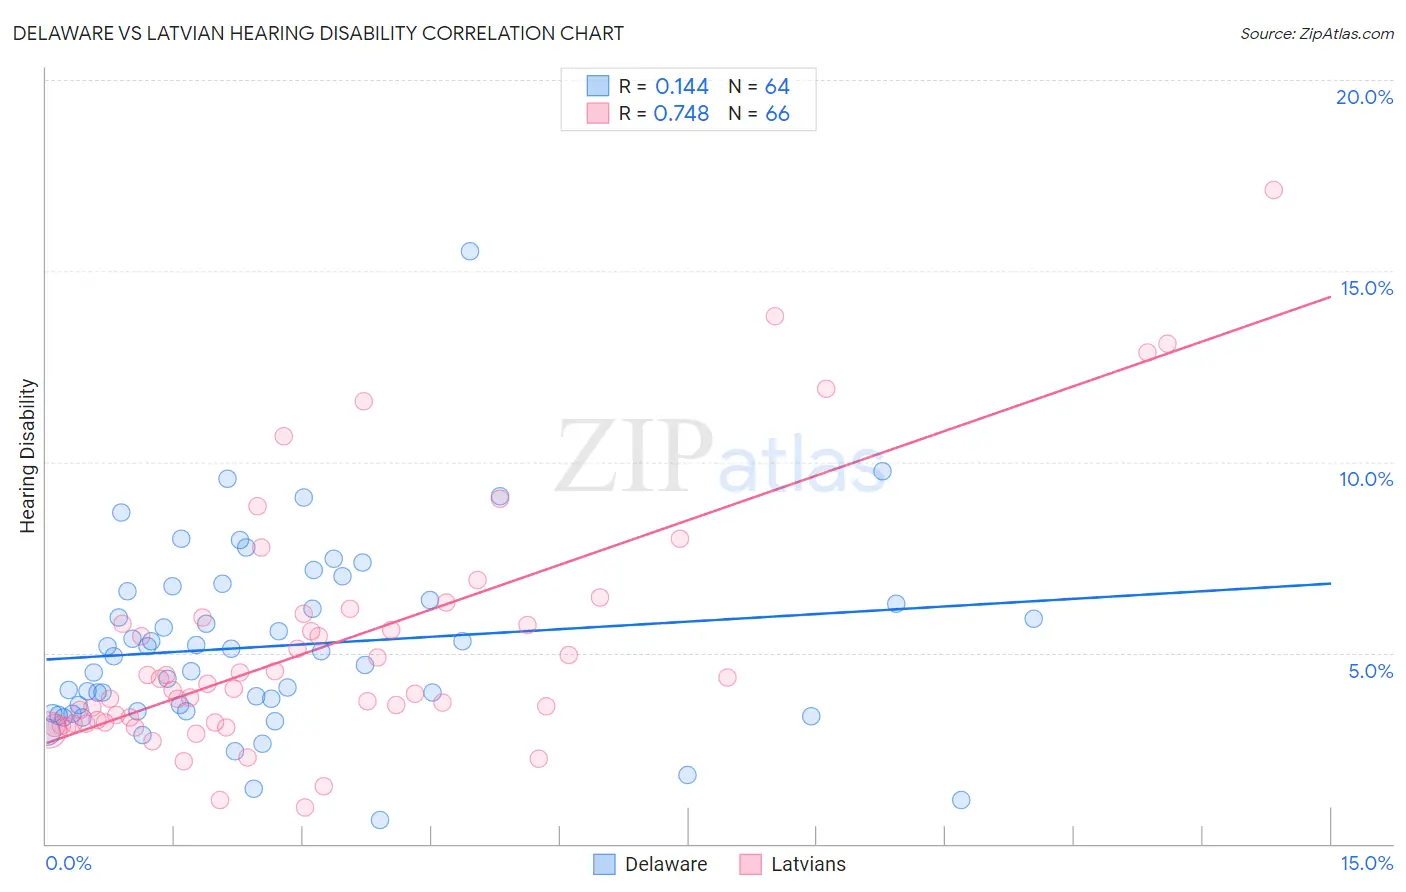
Delaware vs Latvian Hearing Disability Correlation Chart
The statistical analysis conducted on geographies consisting of 96,230,255 people shows a poor positive correlation between the proportion of Delaware and percentage of population with hearing disability in the United States with a correlation coefficient (R) of 0.144 and weighted average of 3.6%. Similarly, the statistical analysis conducted on geographies consisting of 220,695,390 people shows a strong positive correlation between the proportion of Latvians and percentage of population with hearing disability in the United States with a correlation coefficient (R) of 0.748 and weighted average of 3.2%, a difference of 13.8%.
Hearing Disability Correlation Summary
| Measurement | Delaware | Latvian |
| Minimum | 0.61% | 0.95% |
| Maximum | 15.5% | 17.1% |
| Range | 14.9% | 16.2% |
| Mean | 5.2% | 5.2% |
| Median | 5.0% | 4.1% |
| Interquartile 25% (IQ1) | 3.5% | 3.2% |
| Interquartile 75% (IQ3) | 6.5% | 5.9% |
| Interquartile Range (IQR) | 3.0% | 2.8% |
| Standard Deviation (Sample) | 2.4% | 3.2% |
| Standard Deviation (Population) | 2.4% | 3.2% |
Similar Demographics by Hearing Disability
Demographics Similar to Delaware by Hearing Disability
In terms of hearing disability, the demographic groups most similar to Delaware are Sioux (3.6%, a difference of 0.030%), Immigrants from Micronesia (3.6%, a difference of 0.13%), Spanish (3.7%, a difference of 0.24%), Blackfeet (3.6%, a difference of 0.60%), and Irish (3.7%, a difference of 0.82%).
| Demographics | Rating | Rank | Hearing Disability |
| Slovaks | 0.0 /100 | #279 | Tragic 3.6% |
| French American Indians | 0.0 /100 | #280 | Tragic 3.6% |
| Scandinavians | 0.0 /100 | #281 | Tragic 3.6% |
| Swedes | 0.0 /100 | #282 | Tragic 3.6% |
| Blackfeet | 0.0 /100 | #283 | Tragic 3.6% |
| Immigrants | Micronesia | 0.0 /100 | #284 | Tragic 3.6% |
| Sioux | 0.0 /100 | #285 | Tragic 3.6% |
| Delaware | 0.0 /100 | #286 | Tragic 3.6% |
| Spanish | 0.0 /100 | #287 | Tragic 3.7% |
| Irish | 0.0 /100 | #288 | Tragic 3.7% |
| Chinese | 0.0 /100 | #289 | Tragic 3.7% |
| Whites/Caucasians | 0.0 /100 | #290 | Tragic 3.7% |
| Finns | 0.0 /100 | #291 | Tragic 3.7% |
| Native Hawaiians | 0.0 /100 | #292 | Tragic 3.7% |
| Norwegians | 0.0 /100 | #293 | Tragic 3.7% |
Demographics Similar to Latvians by Hearing Disability
In terms of hearing disability, the demographic groups most similar to Latvians are Icelander (3.2%, a difference of 0.040%), Lebanese (3.2%, a difference of 0.040%), Mexican (3.2%, a difference of 0.21%), Bhutanese (3.2%, a difference of 0.23%), and Immigrants from Portugal (3.2%, a difference of 0.42%).
| Demographics | Rating | Rank | Hearing Disability |
| Immigrants | Northern Europe | 7.0 /100 | #218 | Tragic 3.2% |
| New Zealanders | 6.8 /100 | #219 | Tragic 3.2% |
| Malaysians | 6.6 /100 | #220 | Tragic 3.2% |
| Immigrants | Laos | 6.6 /100 | #221 | Tragic 3.2% |
| Immigrants | Oceania | 6.5 /100 | #222 | Tragic 3.2% |
| Mexicans | 5.6 /100 | #223 | Tragic 3.2% |
| Icelanders | 5.2 /100 | #224 | Tragic 3.2% |
| Latvians | 5.1 /100 | #225 | Tragic 3.2% |
| Lebanese | 5.0 /100 | #226 | Tragic 3.2% |
| Bhutanese | 4.6 /100 | #227 | Tragic 3.2% |
| Immigrants | Portugal | 4.3 /100 | #228 | Tragic 3.2% |
| Maltese | 4.1 /100 | #229 | Tragic 3.2% |
| Greeks | 3.2 /100 | #230 | Tragic 3.2% |
| Luxembourgers | 2.9 /100 | #231 | Tragic 3.2% |
| Ukrainians | 2.9 /100 | #232 | Tragic 3.2% |