Brazilian vs Chinese Disability Age 35 to 64
COMPARE
Brazilian
Chinese
Disability Age 35 to 64
Disability Age 35 to 64 Comparison
Brazilians
Chinese
10.5%
DISABILITY AGE 35 TO 64
96.9/ 100
METRIC RATING
111th/ 347
METRIC RANK
10.3%
DISABILITY AGE 35 TO 64
98.7/ 100
METRIC RATING
95th/ 347
METRIC RANK
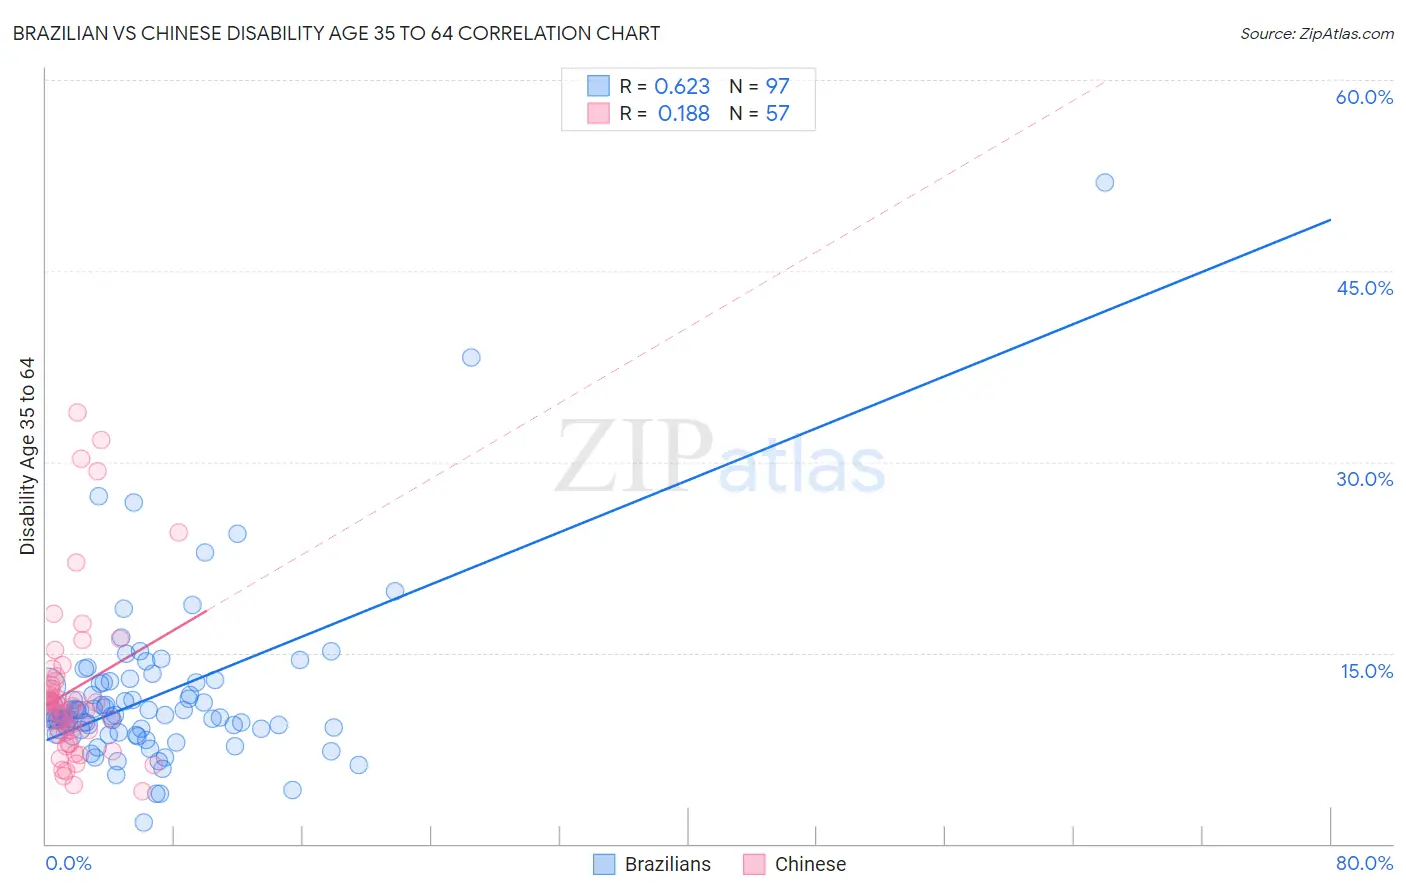
Brazilian vs Chinese Disability Age 35 to 64 Correlation Chart
The statistical analysis conducted on geographies consisting of 323,696,465 people shows a significant positive correlation between the proportion of Brazilians and percentage of population with a disability between the ages 34 and 64 in the United States with a correlation coefficient (R) of 0.623 and weighted average of 10.5%. Similarly, the statistical analysis conducted on geographies consisting of 64,801,742 people shows a poor positive correlation between the proportion of Chinese and percentage of population with a disability between the ages 34 and 64 in the United States with a correlation coefficient (R) of 0.188 and weighted average of 10.3%, a difference of 1.9%.
Disability Age 35 to 64 Correlation Summary
| Measurement | Brazilian | Chinese |
| Minimum | 1.7% | 4.2% |
| Maximum | 51.9% | 33.9% |
| Range | 50.2% | 29.7% |
| Mean | 11.6% | 12.1% |
| Median | 10.1% | 10.8% |
| Interquartile 25% (IQ1) | 8.8% | 8.2% |
| Interquartile 75% (IQ3) | 12.6% | 12.9% |
| Interquartile Range (IQR) | 3.8% | 4.7% |
| Standard Deviation (Sample) | 6.6% | 6.6% |
| Standard Deviation (Population) | 6.5% | 6.5% |
Demographics Similar to Brazilians and Chinese by Disability Age 35 to 64
In terms of disability age 35 to 64, the demographic groups most similar to Brazilians are Assyrian/Chaldean/Syriac (10.5%, a difference of 0.030%), Tongan (10.5%, a difference of 0.15%), Korean (10.5%, a difference of 0.20%), Immigrants from Ethiopia (10.5%, a difference of 0.27%), and Ethiopian (10.5%, a difference of 0.40%). Similarly, the demographic groups most similar to Chinese are Immigrants from Italy (10.3%, a difference of 0.0%), Immigrants from North Macedonia (10.3%, a difference of 0.040%), Immigrants from South Africa (10.3%, a difference of 0.24%), Immigrants from Denmark (10.3%, a difference of 0.42%), and Immigrants from Uruguay (10.3%, a difference of 0.49%).
| Demographics | Rating | Rank | Disability Age 35 to 64 |
| Immigrants | North Macedonia | 98.7 /100 | #93 | Exceptional 10.3% |
| Immigrants | Italy | 98.7 /100 | #94 | Exceptional 10.3% |
| Chinese | 98.7 /100 | #95 | Exceptional 10.3% |
| Immigrants | South Africa | 98.5 /100 | #96 | Exceptional 10.3% |
| Immigrants | Denmark | 98.4 /100 | #97 | Exceptional 10.3% |
| Immigrants | Uruguay | 98.3 /100 | #98 | Exceptional 10.3% |
| Palestinians | 98.2 /100 | #99 | Exceptional 10.4% |
| Immigrants | Jordan | 98.1 /100 | #100 | Exceptional 10.4% |
| Immigrants | Philippines | 98.0 /100 | #101 | Exceptional 10.4% |
| Immigrants | Western Asia | 98.0 /100 | #102 | Exceptional 10.4% |
| Immigrants | Ukraine | 97.9 /100 | #103 | Exceptional 10.4% |
| Immigrants | Austria | 97.8 /100 | #104 | Exceptional 10.4% |
| Macedonians | 97.8 /100 | #105 | Exceptional 10.4% |
| Immigrants | Hungary | 97.6 /100 | #106 | Exceptional 10.4% |
| Zimbabweans | 97.4 /100 | #107 | Exceptional 10.4% |
| Ethiopians | 97.4 /100 | #108 | Exceptional 10.5% |
| Immigrants | Ethiopia | 97.2 /100 | #109 | Exceptional 10.5% |
| Koreans | 97.1 /100 | #110 | Exceptional 10.5% |
| Brazilians | 96.9 /100 | #111 | Exceptional 10.5% |
| Assyrians/Chaldeans/Syriacs | 96.8 /100 | #112 | Exceptional 10.5% |
| Tongans | 96.6 /100 | #113 | Exceptional 10.5% |