Black/African American vs Scotch-Irish Self-Care Disability
COMPARE
Black/African American
Scotch-Irish
Self-Care Disability
Self-Care Disability Comparison
Blacks/African Americans
Scotch-Irish
2.9%
SELF-CARE DISABILITY
0.0/ 100
METRIC RATING
327th/ 347
METRIC RANK
2.6%
SELF-CARE DISABILITY
4.1/ 100
METRIC RATING
218th/ 347
METRIC RANK
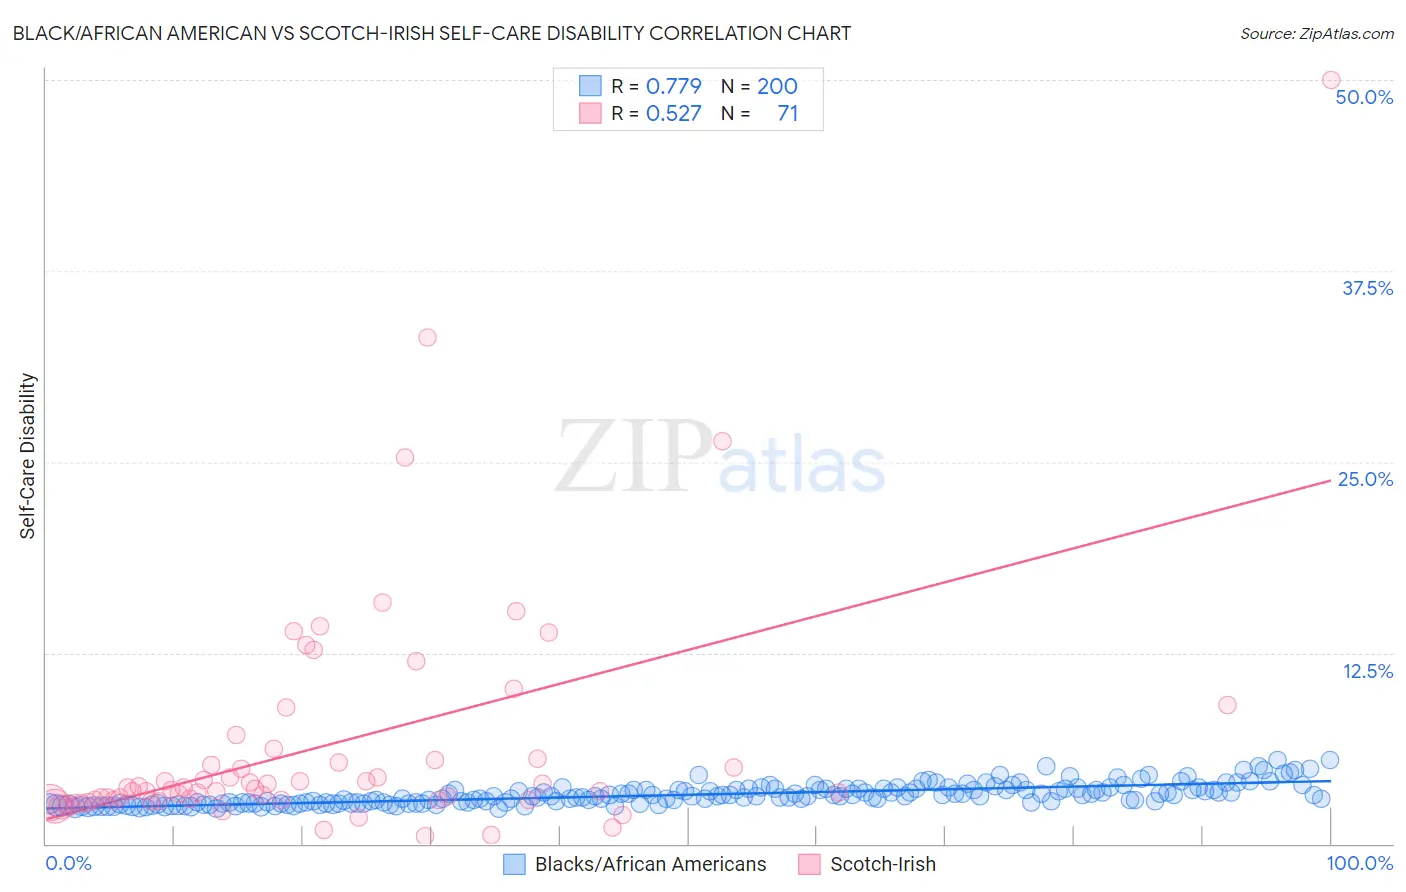
Black/African American vs Scotch-Irish Self-Care Disability Correlation Chart
The statistical analysis conducted on geographies consisting of 564,146,018 people shows a strong positive correlation between the proportion of Blacks/African Americans and percentage of population with self-care disability in the United States with a correlation coefficient (R) of 0.779 and weighted average of 2.9%. Similarly, the statistical analysis conducted on geographies consisting of 547,085,910 people shows a substantial positive correlation between the proportion of Scotch-Irish and percentage of population with self-care disability in the United States with a correlation coefficient (R) of 0.527 and weighted average of 2.6%, a difference of 14.2%.
Self-Care Disability Correlation Summary
| Measurement | Black/African American | Scotch-Irish |
| Minimum | 2.3% | 0.47% |
| Maximum | 5.5% | 50.0% |
| Range | 3.2% | 49.5% |
| Mean | 3.2% | 6.5% |
| Median | 3.1% | 3.6% |
| Interquartile 25% (IQ1) | 2.7% | 2.8% |
| Interquartile 75% (IQ3) | 3.6% | 5.6% |
| Interquartile Range (IQR) | 0.89% | 2.7% |
| Standard Deviation (Sample) | 0.67% | 8.0% |
| Standard Deviation (Population) | 0.67% | 7.9% |
Similar Demographics by Self-Care Disability
Demographics Similar to Blacks/African Americans by Self-Care Disability
In terms of self-care disability, the demographic groups most similar to Blacks/African Americans are Paiute (2.9%, a difference of 0.070%), Hopi (2.9%, a difference of 0.39%), Cajun (2.9%, a difference of 0.60%), Immigrants from Uzbekistan (2.9%, a difference of 1.0%), and Nepalese (3.0%, a difference of 1.3%).
| Demographics | Rating | Rank | Self-Care Disability |
| Chickasaw | 0.0 /100 | #320 | Tragic 2.9% |
| Navajo | 0.0 /100 | #321 | Tragic 2.9% |
| Comanche | 0.0 /100 | #322 | Tragic 2.9% |
| Seminole | 0.0 /100 | #323 | Tragic 2.9% |
| Cherokee | 0.0 /100 | #324 | Tragic 2.9% |
| Immigrants | Uzbekistan | 0.0 /100 | #325 | Tragic 2.9% |
| Paiute | 0.0 /100 | #326 | Tragic 2.9% |
| Blacks/African Americans | 0.0 /100 | #327 | Tragic 2.9% |
| Hopi | 0.0 /100 | #328 | Tragic 2.9% |
| Cajuns | 0.0 /100 | #329 | Tragic 2.9% |
| Nepalese | 0.0 /100 | #330 | Tragic 3.0% |
| Lumbee | 0.0 /100 | #331 | Tragic 3.0% |
| Kiowa | 0.0 /100 | #332 | Tragic 3.0% |
| Dutch West Indians | 0.0 /100 | #333 | Tragic 3.0% |
| Houma | 0.0 /100 | #334 | Tragic 3.0% |
Demographics Similar to Scotch-Irish by Self-Care Disability
In terms of self-care disability, the demographic groups most similar to Scotch-Irish are Immigrants from Moldova (2.6%, a difference of 0.030%), Subsaharan African (2.6%, a difference of 0.040%), Celtic (2.6%, a difference of 0.070%), Honduran (2.6%, a difference of 0.080%), and White/Caucasian (2.6%, a difference of 0.090%).
| Demographics | Rating | Rank | Self-Care Disability |
| Native Hawaiians | 5.1 /100 | #211 | Tragic 2.6% |
| Samoans | 5.1 /100 | #212 | Tragic 2.6% |
| Ecuadorians | 4.7 /100 | #213 | Tragic 2.6% |
| Immigrants | Honduras | 4.7 /100 | #214 | Tragic 2.6% |
| Immigrants | Thailand | 4.5 /100 | #215 | Tragic 2.6% |
| Whites/Caucasians | 4.4 /100 | #216 | Tragic 2.6% |
| Celtics | 4.4 /100 | #217 | Tragic 2.6% |
| Scotch-Irish | 4.1 /100 | #218 | Tragic 2.6% |
| Immigrants | Moldova | 4.0 /100 | #219 | Tragic 2.6% |
| Sub-Saharan Africans | 4.0 /100 | #220 | Tragic 2.6% |
| Hondurans | 3.8 /100 | #221 | Tragic 2.6% |
| Spaniards | 3.8 /100 | #222 | Tragic 2.6% |
| French Canadians | 3.8 /100 | #223 | Tragic 2.6% |
| Osage | 3.6 /100 | #224 | Tragic 2.6% |
| Iraqis | 3.2 /100 | #225 | Tragic 2.6% |