Black/African American vs Immigrants from Central America Self-Care Disability
COMPARE
Black/African American
Immigrants from Central America
Self-Care Disability
Self-Care Disability Comparison
Blacks/African Americans
Immigrants from Central America
2.9%
SELF-CARE DISABILITY
0.0/ 100
METRIC RATING
327th/ 347
METRIC RANK
2.6%
SELF-CARE DISABILITY
0.3/ 100
METRIC RATING
256th/ 347
METRIC RANK
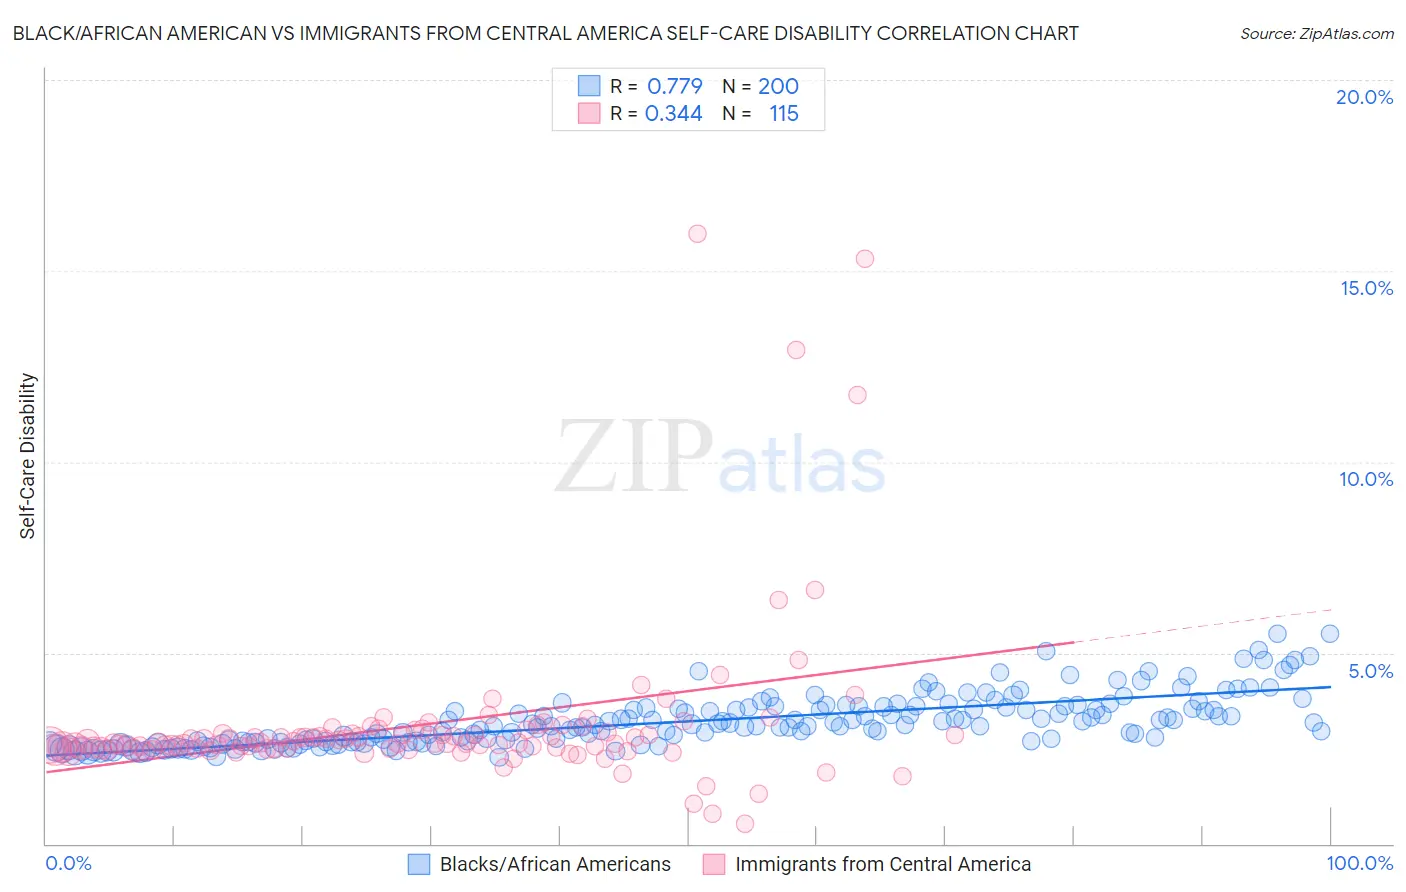
Black/African American vs Immigrants from Central America Self-Care Disability Correlation Chart
The statistical analysis conducted on geographies consisting of 564,146,018 people shows a strong positive correlation between the proportion of Blacks/African Americans and percentage of population with self-care disability in the United States with a correlation coefficient (R) of 0.779 and weighted average of 2.9%. Similarly, the statistical analysis conducted on geographies consisting of 534,996,310 people shows a mild positive correlation between the proportion of Immigrants from Central America and percentage of population with self-care disability in the United States with a correlation coefficient (R) of 0.344 and weighted average of 2.6%, a difference of 11.0%.
Self-Care Disability Correlation Summary
| Measurement | Black/African American | Immigrants from Central America |
| Minimum | 2.3% | 0.52% |
| Maximum | 5.5% | 16.0% |
| Range | 3.2% | 15.5% |
| Mean | 3.2% | 3.1% |
| Median | 3.1% | 2.6% |
| Interquartile 25% (IQ1) | 2.7% | 2.5% |
| Interquartile 75% (IQ3) | 3.6% | 2.9% |
| Interquartile Range (IQR) | 0.89% | 0.43% |
| Standard Deviation (Sample) | 0.67% | 2.2% |
| Standard Deviation (Population) | 0.67% | 2.2% |
Similar Demographics by Self-Care Disability
Demographics Similar to Blacks/African Americans by Self-Care Disability
In terms of self-care disability, the demographic groups most similar to Blacks/African Americans are Paiute (2.9%, a difference of 0.070%), Hopi (2.9%, a difference of 0.39%), Cajun (2.9%, a difference of 0.60%), Immigrants from Uzbekistan (2.9%, a difference of 1.0%), and Nepalese (3.0%, a difference of 1.3%).
| Demographics | Rating | Rank | Self-Care Disability |
| Chickasaw | 0.0 /100 | #320 | Tragic 2.9% |
| Navajo | 0.0 /100 | #321 | Tragic 2.9% |
| Comanche | 0.0 /100 | #322 | Tragic 2.9% |
| Seminole | 0.0 /100 | #323 | Tragic 2.9% |
| Cherokee | 0.0 /100 | #324 | Tragic 2.9% |
| Immigrants | Uzbekistan | 0.0 /100 | #325 | Tragic 2.9% |
| Paiute | 0.0 /100 | #326 | Tragic 2.9% |
| Blacks/African Americans | 0.0 /100 | #327 | Tragic 2.9% |
| Hopi | 0.0 /100 | #328 | Tragic 2.9% |
| Cajuns | 0.0 /100 | #329 | Tragic 2.9% |
| Nepalese | 0.0 /100 | #330 | Tragic 3.0% |
| Lumbee | 0.0 /100 | #331 | Tragic 3.0% |
| Kiowa | 0.0 /100 | #332 | Tragic 3.0% |
| Dutch West Indians | 0.0 /100 | #333 | Tragic 3.0% |
| Houma | 0.0 /100 | #334 | Tragic 3.0% |
Demographics Similar to Immigrants from Central America by Self-Care Disability
In terms of self-care disability, the demographic groups most similar to Immigrants from Central America are Tsimshian (2.6%, a difference of 0.020%), Haitian (2.6%, a difference of 0.060%), Immigrants from Haiti (2.6%, a difference of 0.080%), Immigrants from Bangladesh (2.6%, a difference of 0.16%), and Potawatomi (2.6%, a difference of 0.20%).
| Demographics | Rating | Rank | Self-Care Disability |
| Mexican American Indians | 0.5 /100 | #249 | Tragic 2.6% |
| Portuguese | 0.4 /100 | #250 | Tragic 2.6% |
| Immigrants | Liberia | 0.4 /100 | #251 | Tragic 2.6% |
| Immigrants | Bangladesh | 0.4 /100 | #252 | Tragic 2.6% |
| Immigrants | Haiti | 0.3 /100 | #253 | Tragic 2.6% |
| Haitians | 0.3 /100 | #254 | Tragic 2.6% |
| Tsimshian | 0.3 /100 | #255 | Tragic 2.6% |
| Immigrants | Central America | 0.3 /100 | #256 | Tragic 2.6% |
| Potawatomi | 0.3 /100 | #257 | Tragic 2.6% |
| Immigrants | Nonimmigrants | 0.3 /100 | #258 | Tragic 2.6% |
| Immigrants | Belarus | 0.2 /100 | #259 | Tragic 2.6% |
| Chippewa | 0.2 /100 | #260 | Tragic 2.6% |
| Arapaho | 0.2 /100 | #261 | Tragic 2.6% |
| Shoshone | 0.2 /100 | #262 | Tragic 2.7% |
| Immigrants | Latin America | 0.2 /100 | #263 | Tragic 2.7% |