Immigrants from Guatemala vs Ukrainian Cognitive Disability
COMPARE
Immigrants from Guatemala
Ukrainian
Cognitive Disability
Cognitive Disability Comparison
Immigrants from Guatemala
Ukrainians
17.7%
COGNITIVE DISABILITY
2.2/ 100
METRIC RATING
229th/ 347
METRIC RANK
16.6%
COGNITIVE DISABILITY
99.4/ 100
METRIC RATING
68th/ 347
METRIC RANK
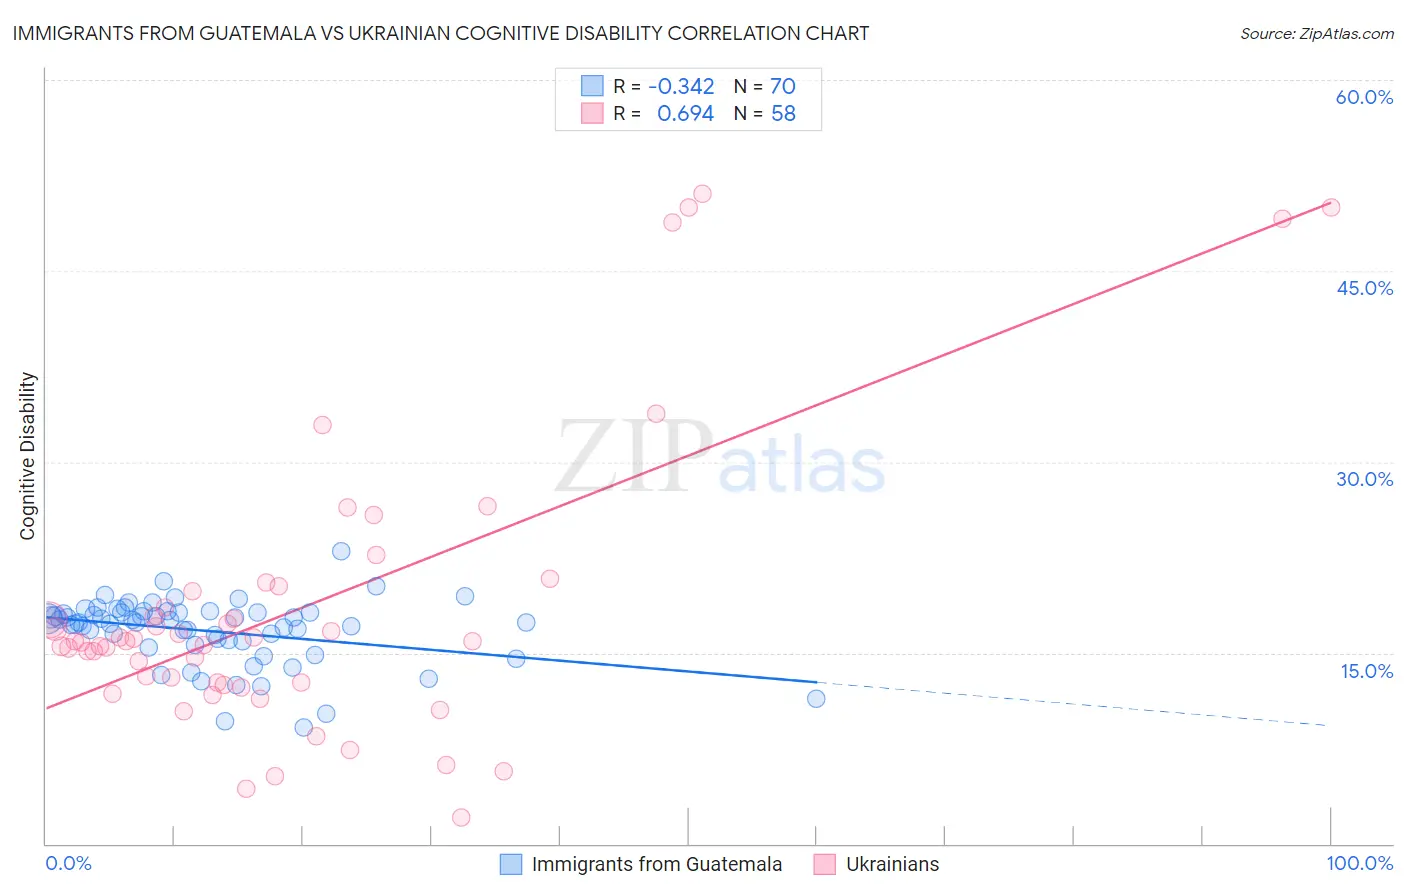
Immigrants from Guatemala vs Ukrainian Cognitive Disability Correlation Chart
The statistical analysis conducted on geographies consisting of 377,233,463 people shows a mild negative correlation between the proportion of Immigrants from Guatemala and percentage of population with cognitive disability in the United States with a correlation coefficient (R) of -0.342 and weighted average of 17.7%. Similarly, the statistical analysis conducted on geographies consisting of 448,632,729 people shows a significant positive correlation between the proportion of Ukrainians and percentage of population with cognitive disability in the United States with a correlation coefficient (R) of 0.694 and weighted average of 16.6%, a difference of 6.6%.
Cognitive Disability Correlation Summary
| Measurement | Immigrants from Guatemala | Ukrainian |
| Minimum | 9.1% | 2.1% |
| Maximum | 22.9% | 51.1% |
| Range | 13.8% | 49.0% |
| Mean | 16.7% | 18.5% |
| Median | 17.4% | 15.9% |
| Interquartile 25% (IQ1) | 15.9% | 12.6% |
| Interquartile 75% (IQ3) | 18.2% | 19.9% |
| Interquartile Range (IQR) | 2.3% | 7.2% |
| Standard Deviation (Sample) | 2.6% | 11.4% |
| Standard Deviation (Population) | 2.5% | 11.3% |
Similar Demographics by Cognitive Disability
Demographics Similar to Immigrants from Guatemala by Cognitive Disability
In terms of cognitive disability, the demographic groups most similar to Immigrants from Guatemala are Immigrants from Central America (17.7%, a difference of 0.020%), Mongolian (17.7%, a difference of 0.020%), Guatemalan (17.8%, a difference of 0.060%), Tongan (17.8%, a difference of 0.060%), and Panamanian (17.8%, a difference of 0.060%).
| Demographics | Rating | Rank | Cognitive Disability |
| Central Americans | 4.5 /100 | #222 | Tragic 17.7% |
| Alsatians | 4.5 /100 | #223 | Tragic 17.7% |
| Fijians | 3.4 /100 | #224 | Tragic 17.7% |
| Vietnamese | 3.4 /100 | #225 | Tragic 17.7% |
| Marshallese | 2.7 /100 | #226 | Tragic 17.7% |
| Immigrants | St. Vincent and the Grenadines | 2.6 /100 | #227 | Tragic 17.7% |
| Immigrants | Central America | 2.3 /100 | #228 | Tragic 17.7% |
| Immigrants | Guatemala | 2.2 /100 | #229 | Tragic 17.7% |
| Mongolians | 2.2 /100 | #230 | Tragic 17.7% |
| Guatemalans | 2.1 /100 | #231 | Tragic 17.8% |
| Tongans | 2.1 /100 | #232 | Tragic 17.8% |
| Panamanians | 2.1 /100 | #233 | Tragic 17.8% |
| Osage | 2.0 /100 | #234 | Tragic 17.8% |
| Spanish American Indians | 2.0 /100 | #235 | Tragic 17.8% |
| Immigrants | Iraq | 1.8 /100 | #236 | Tragic 17.8% |
Demographics Similar to Ukrainians by Cognitive Disability
In terms of cognitive disability, the demographic groups most similar to Ukrainians are Latvian (16.6%, a difference of 0.040%), Immigrants from Ukraine (16.6%, a difference of 0.080%), Immigrants from Uzbekistan (16.7%, a difference of 0.080%), Immigrants from Sweden (16.7%, a difference of 0.090%), and Immigrants from Belgium (16.7%, a difference of 0.10%).
| Demographics | Rating | Rank | Cognitive Disability |
| Immigrants | England | 99.6 /100 | #61 | Exceptional 16.6% |
| Czechoslovakians | 99.6 /100 | #62 | Exceptional 16.6% |
| Argentineans | 99.6 /100 | #63 | Exceptional 16.6% |
| Venezuelans | 99.6 /100 | #64 | Exceptional 16.6% |
| Colombians | 99.6 /100 | #65 | Exceptional 16.6% |
| Immigrants | Ukraine | 99.5 /100 | #66 | Exceptional 16.6% |
| Latvians | 99.5 /100 | #67 | Exceptional 16.6% |
| Ukrainians | 99.4 /100 | #68 | Exceptional 16.6% |
| Immigrants | Uzbekistan | 99.4 /100 | #69 | Exceptional 16.7% |
| Immigrants | Sweden | 99.4 /100 | #70 | Exceptional 16.7% |
| Immigrants | Belgium | 99.3 /100 | #71 | Exceptional 16.7% |
| Germans | 99.3 /100 | #72 | Exceptional 16.7% |
| Burmese | 99.3 /100 | #73 | Exceptional 16.7% |
| Slavs | 99.3 /100 | #74 | Exceptional 16.7% |
| Estonians | 99.3 /100 | #75 | Exceptional 16.7% |