Croatian vs Ukrainian Cognitive Disability
COMPARE
Croatian
Ukrainian
Cognitive Disability
Cognitive Disability Comparison
Croatians
Ukrainians
16.4%
COGNITIVE DISABILITY
99.9/ 100
METRIC RATING
23rd/ 347
METRIC RANK
16.6%
COGNITIVE DISABILITY
99.4/ 100
METRIC RATING
68th/ 347
METRIC RANK
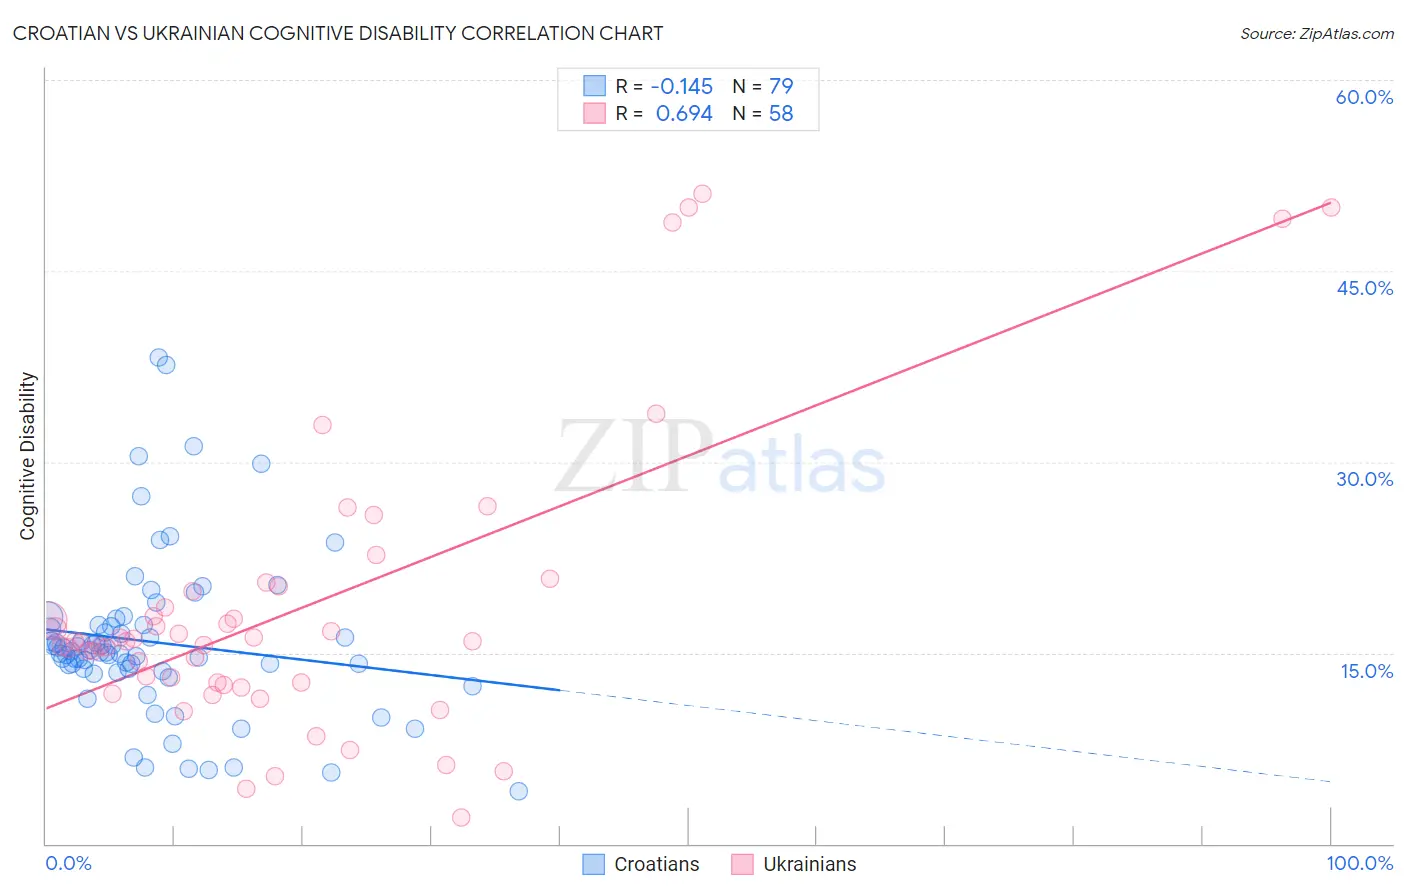
Croatian vs Ukrainian Cognitive Disability Correlation Chart
The statistical analysis conducted on geographies consisting of 375,711,663 people shows a poor negative correlation between the proportion of Croatians and percentage of population with cognitive disability in the United States with a correlation coefficient (R) of -0.145 and weighted average of 16.4%. Similarly, the statistical analysis conducted on geographies consisting of 448,632,729 people shows a significant positive correlation between the proportion of Ukrainians and percentage of population with cognitive disability in the United States with a correlation coefficient (R) of 0.694 and weighted average of 16.6%, a difference of 1.7%.
Cognitive Disability Correlation Summary
| Measurement | Croatian | Ukrainian |
| Minimum | 4.2% | 2.1% |
| Maximum | 38.2% | 51.1% |
| Range | 34.0% | 49.0% |
| Mean | 15.8% | 18.5% |
| Median | 15.1% | 15.9% |
| Interquartile 25% (IQ1) | 13.5% | 12.6% |
| Interquartile 75% (IQ3) | 17.1% | 19.9% |
| Interquartile Range (IQR) | 3.6% | 7.2% |
| Standard Deviation (Sample) | 6.4% | 11.4% |
| Standard Deviation (Population) | 6.3% | 11.3% |
Similar Demographics by Cognitive Disability
Demographics Similar to Croatians by Cognitive Disability
In terms of cognitive disability, the demographic groups most similar to Croatians are Immigrants from South Central Asia (16.4%, a difference of 0.030%), Immigrants from Argentina (16.4%, a difference of 0.030%), Luxembourger (16.4%, a difference of 0.060%), Immigrants from Croatia (16.4%, a difference of 0.10%), and Immigrants from Pakistan (16.4%, a difference of 0.12%).
| Demographics | Rating | Rank | Cognitive Disability |
| Eastern Europeans | 100.0 /100 | #16 | Exceptional 16.3% |
| Immigrants | North Macedonia | 100.0 /100 | #17 | Exceptional 16.3% |
| Immigrants | Northern Europe | 100.0 /100 | #18 | Exceptional 16.3% |
| Immigrants | Bolivia | 100.0 /100 | #19 | Exceptional 16.3% |
| Bulgarians | 100.0 /100 | #20 | Exceptional 16.3% |
| Immigrants | Cuba | 100.0 /100 | #21 | Exceptional 16.3% |
| Immigrants | South Central Asia | 99.9 /100 | #22 | Exceptional 16.4% |
| Croatians | 99.9 /100 | #23 | Exceptional 16.4% |
| Immigrants | Argentina | 99.9 /100 | #24 | Exceptional 16.4% |
| Luxembourgers | 99.9 /100 | #25 | Exceptional 16.4% |
| Immigrants | Croatia | 99.9 /100 | #26 | Exceptional 16.4% |
| Immigrants | Pakistan | 99.9 /100 | #27 | Exceptional 16.4% |
| Poles | 99.9 /100 | #28 | Exceptional 16.4% |
| Filipinos | 99.9 /100 | #29 | Exceptional 16.4% |
| Czechs | 99.9 /100 | #30 | Exceptional 16.4% |
Demographics Similar to Ukrainians by Cognitive Disability
In terms of cognitive disability, the demographic groups most similar to Ukrainians are Latvian (16.6%, a difference of 0.040%), Immigrants from Ukraine (16.6%, a difference of 0.080%), Immigrants from Uzbekistan (16.7%, a difference of 0.080%), Immigrants from Sweden (16.7%, a difference of 0.090%), and Immigrants from Belgium (16.7%, a difference of 0.10%).
| Demographics | Rating | Rank | Cognitive Disability |
| Immigrants | England | 99.6 /100 | #61 | Exceptional 16.6% |
| Czechoslovakians | 99.6 /100 | #62 | Exceptional 16.6% |
| Argentineans | 99.6 /100 | #63 | Exceptional 16.6% |
| Venezuelans | 99.6 /100 | #64 | Exceptional 16.6% |
| Colombians | 99.6 /100 | #65 | Exceptional 16.6% |
| Immigrants | Ukraine | 99.5 /100 | #66 | Exceptional 16.6% |
| Latvians | 99.5 /100 | #67 | Exceptional 16.6% |
| Ukrainians | 99.4 /100 | #68 | Exceptional 16.6% |
| Immigrants | Uzbekistan | 99.4 /100 | #69 | Exceptional 16.7% |
| Immigrants | Sweden | 99.4 /100 | #70 | Exceptional 16.7% |
| Immigrants | Belgium | 99.3 /100 | #71 | Exceptional 16.7% |
| Germans | 99.3 /100 | #72 | Exceptional 16.7% |
| Burmese | 99.3 /100 | #73 | Exceptional 16.7% |
| Slavs | 99.3 /100 | #74 | Exceptional 16.7% |
| Estonians | 99.3 /100 | #75 | Exceptional 16.7% |