Black/African American vs Immigrants from Japan Hearing Disability
COMPARE
Black/African American
Immigrants from Japan
Hearing Disability
Hearing Disability Comparison
Blacks/African Americans
Immigrants from Japan
3.0%
HEARING DISABILITY
34.7/ 100
METRIC RATING
187th/ 347
METRIC RANK
2.9%
HEARING DISABILITY
66.3/ 100
METRIC RATING
162nd/ 347
METRIC RANK
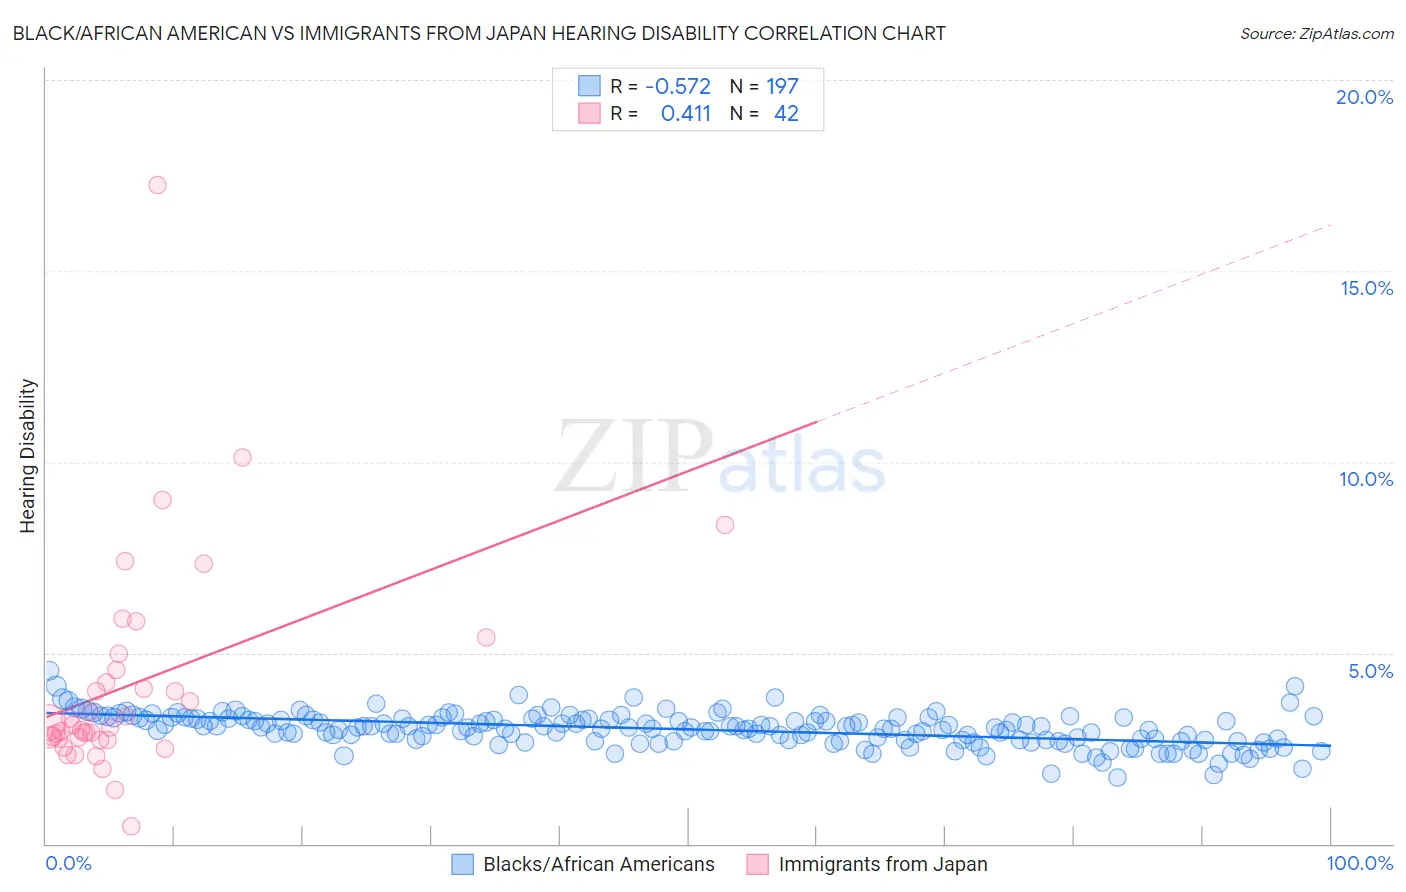
Black/African American vs Immigrants from Japan Hearing Disability Correlation Chart
The statistical analysis conducted on geographies consisting of 565,046,012 people shows a substantial negative correlation between the proportion of Blacks/African Americans and percentage of population with hearing disability in the United States with a correlation coefficient (R) of -0.572 and weighted average of 3.0%. Similarly, the statistical analysis conducted on geographies consisting of 340,074,925 people shows a moderate positive correlation between the proportion of Immigrants from Japan and percentage of population with hearing disability in the United States with a correlation coefficient (R) of 0.411 and weighted average of 2.9%, a difference of 3.1%.
Hearing Disability Correlation Summary
| Measurement | Black/African American | Immigrants from Japan |
| Minimum | 1.7% | 0.47% |
| Maximum | 4.5% | 17.2% |
| Range | 2.8% | 16.8% |
| Mean | 3.0% | 4.2% |
| Median | 3.0% | 3.1% |
| Interquartile 25% (IQ1) | 2.7% | 2.7% |
| Interquartile 75% (IQ3) | 3.3% | 4.6% |
| Interquartile Range (IQR) | 0.56% | 1.8% |
| Standard Deviation (Sample) | 0.43% | 2.9% |
| Standard Deviation (Population) | 0.43% | 2.9% |
Similar Demographics by Hearing Disability
Demographics Similar to Blacks/African Americans by Hearing Disability
In terms of hearing disability, the demographic groups most similar to Blacks/African Americans are Immigrants from Mexico (3.0%, a difference of 0.010%), Mexican American Indian (3.0%, a difference of 0.010%), Immigrants from Southern Europe (3.0%, a difference of 0.060%), African (3.0%, a difference of 0.19%), and Immigrants from Ireland (3.0%, a difference of 0.27%).
| Demographics | Rating | Rank | Hearing Disability |
| Immigrants | Sweden | 42.4 /100 | #180 | Average 3.0% |
| Immigrants | Belgium | 41.5 /100 | #181 | Average 3.0% |
| Immigrants | Italy | 41.1 /100 | #182 | Average 3.0% |
| Bulgarians | 39.7 /100 | #183 | Fair 3.0% |
| Immigrants | Ireland | 37.4 /100 | #184 | Fair 3.0% |
| Immigrants | Southern Europe | 35.3 /100 | #185 | Fair 3.0% |
| Immigrants | Mexico | 34.9 /100 | #186 | Fair 3.0% |
| Blacks/African Americans | 34.7 /100 | #187 | Fair 3.0% |
| Mexican American Indians | 34.7 /100 | #188 | Fair 3.0% |
| Africans | 32.9 /100 | #189 | Fair 3.0% |
| Immigrants | South Africa | 31.1 /100 | #190 | Fair 3.1% |
| Immigrants | Switzerland | 28.8 /100 | #191 | Fair 3.1% |
| Koreans | 27.6 /100 | #192 | Fair 3.1% |
| Macedonians | 27.0 /100 | #193 | Fair 3.1% |
| South Africans | 24.5 /100 | #194 | Fair 3.1% |
Demographics Similar to Immigrants from Japan by Hearing Disability
In terms of hearing disability, the demographic groups most similar to Immigrants from Japan are Albanian (2.9%, a difference of 0.030%), Immigrants from Fiji (2.9%, a difference of 0.090%), Immigrants from Australia (2.9%, a difference of 0.11%), Immigrants from Central America (3.0%, a difference of 0.15%), and Immigrants from Cambodia (3.0%, a difference of 0.16%).
| Demographics | Rating | Rank | Hearing Disability |
| Costa Ricans | 71.4 /100 | #155 | Good 2.9% |
| Immigrants | Poland | 70.2 /100 | #156 | Good 2.9% |
| Immigrants | Kazakhstan | 69.6 /100 | #157 | Good 2.9% |
| Immigrants | Burma/Myanmar | 69.5 /100 | #158 | Good 2.9% |
| Immigrants | Australia | 67.4 /100 | #159 | Good 2.9% |
| Immigrants | Fiji | 67.1 /100 | #160 | Good 2.9% |
| Albanians | 66.6 /100 | #161 | Good 2.9% |
| Immigrants | Japan | 66.3 /100 | #162 | Good 2.9% |
| Immigrants | Central America | 64.9 /100 | #163 | Good 3.0% |
| Immigrants | Cambodia | 64.8 /100 | #164 | Good 3.0% |
| Immigrants | Zimbabwe | 64.2 /100 | #165 | Good 3.0% |
| Immigrants | South Eastern Asia | 62.9 /100 | #166 | Good 3.0% |
| Immigrants | Eastern Europe | 58.1 /100 | #167 | Average 3.0% |
| Immigrants | Greece | 57.9 /100 | #168 | Average 3.0% |
| Arabs | 57.6 /100 | #169 | Average 3.0% |