Black/African American vs Immigrants from Indonesia Hearing Disability
COMPARE
Black/African American
Immigrants from Indonesia
Hearing Disability
Hearing Disability Comparison
Blacks/African Americans
Immigrants from Indonesia
3.0%
HEARING DISABILITY
34.7/ 100
METRIC RATING
187th/ 347
METRIC RANK
2.8%
HEARING DISABILITY
94.7/ 100
METRIC RATING
103rd/ 347
METRIC RANK
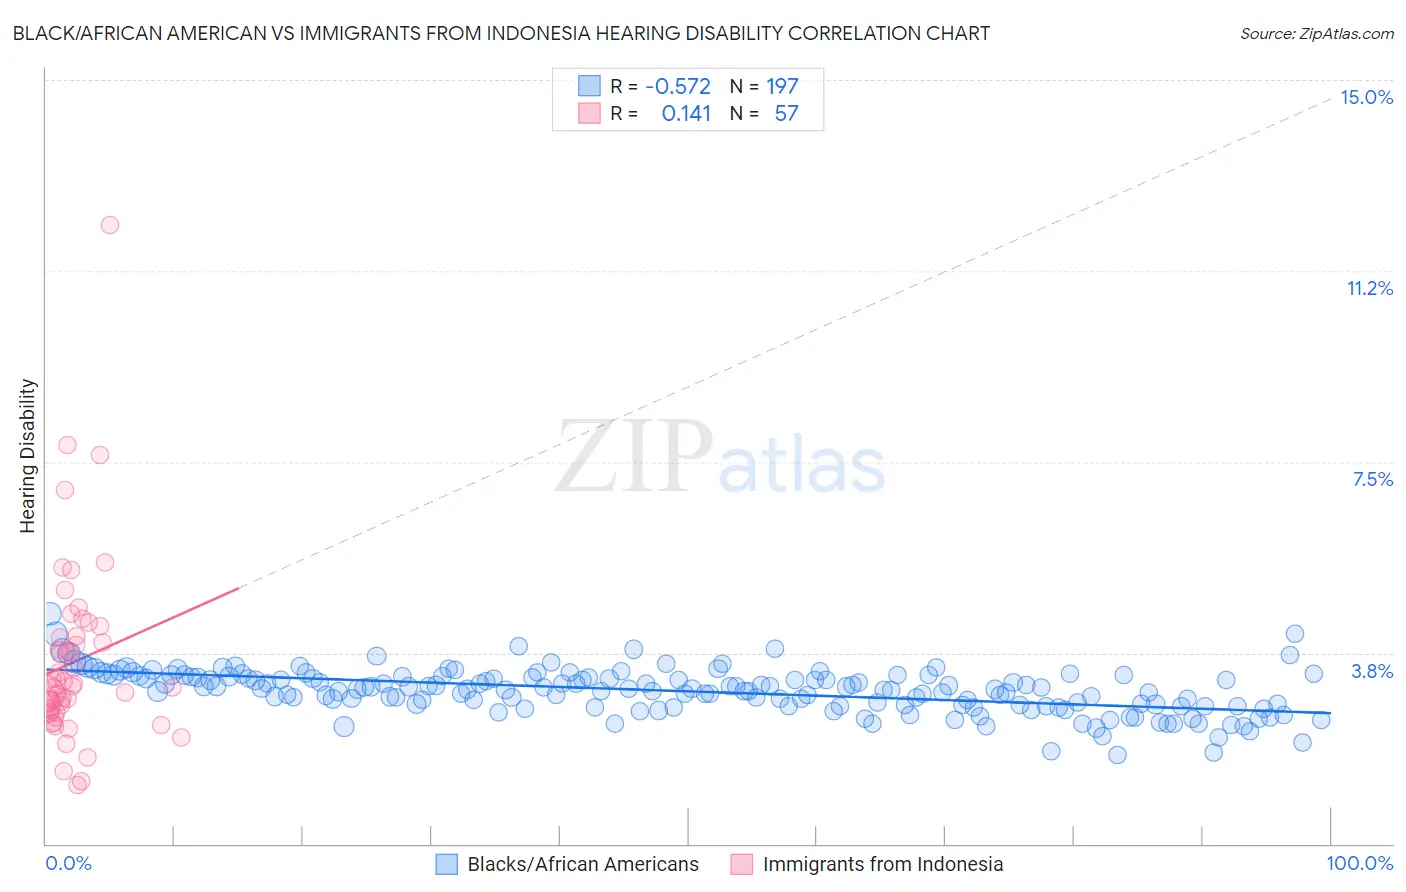
Black/African American vs Immigrants from Indonesia Hearing Disability Correlation Chart
The statistical analysis conducted on geographies consisting of 565,046,012 people shows a substantial negative correlation between the proportion of Blacks/African Americans and percentage of population with hearing disability in the United States with a correlation coefficient (R) of -0.572 and weighted average of 3.0%. Similarly, the statistical analysis conducted on geographies consisting of 215,771,622 people shows a poor positive correlation between the proportion of Immigrants from Indonesia and percentage of population with hearing disability in the United States with a correlation coefficient (R) of 0.141 and weighted average of 2.8%, a difference of 8.9%.
Hearing Disability Correlation Summary
| Measurement | Black/African American | Immigrants from Indonesia |
| Minimum | 1.7% | 1.2% |
| Maximum | 4.5% | 12.2% |
| Range | 2.8% | 11.0% |
| Mean | 3.0% | 3.6% |
| Median | 3.0% | 3.1% |
| Interquartile 25% (IQ1) | 2.7% | 2.6% |
| Interquartile 75% (IQ3) | 3.3% | 4.1% |
| Interquartile Range (IQR) | 0.56% | 1.5% |
| Standard Deviation (Sample) | 0.43% | 1.8% |
| Standard Deviation (Population) | 0.43% | 1.8% |
Similar Demographics by Hearing Disability
Demographics Similar to Blacks/African Americans by Hearing Disability
In terms of hearing disability, the demographic groups most similar to Blacks/African Americans are Immigrants from Mexico (3.0%, a difference of 0.010%), Mexican American Indian (3.0%, a difference of 0.010%), Immigrants from Southern Europe (3.0%, a difference of 0.060%), African (3.0%, a difference of 0.19%), and Immigrants from Ireland (3.0%, a difference of 0.27%).
| Demographics | Rating | Rank | Hearing Disability |
| Immigrants | Sweden | 42.4 /100 | #180 | Average 3.0% |
| Immigrants | Belgium | 41.5 /100 | #181 | Average 3.0% |
| Immigrants | Italy | 41.1 /100 | #182 | Average 3.0% |
| Bulgarians | 39.7 /100 | #183 | Fair 3.0% |
| Immigrants | Ireland | 37.4 /100 | #184 | Fair 3.0% |
| Immigrants | Southern Europe | 35.3 /100 | #185 | Fair 3.0% |
| Immigrants | Mexico | 34.9 /100 | #186 | Fair 3.0% |
| Blacks/African Americans | 34.7 /100 | #187 | Fair 3.0% |
| Mexican American Indians | 34.7 /100 | #188 | Fair 3.0% |
| Africans | 32.9 /100 | #189 | Fair 3.0% |
| Immigrants | South Africa | 31.1 /100 | #190 | Fair 3.1% |
| Immigrants | Switzerland | 28.8 /100 | #191 | Fair 3.1% |
| Koreans | 27.6 /100 | #192 | Fair 3.1% |
| Macedonians | 27.0 /100 | #193 | Fair 3.1% |
| South Africans | 24.5 /100 | #194 | Fair 3.1% |
Demographics Similar to Immigrants from Indonesia by Hearing Disability
In terms of hearing disability, the demographic groups most similar to Immigrants from Indonesia are Taiwanese (2.8%, a difference of 0.050%), Immigrants from Spain (2.8%, a difference of 0.060%), Immigrants from Eastern Africa (2.8%, a difference of 0.12%), Immigrants from Guatemala (2.8%, a difference of 0.17%), and Immigrants from Honduras (2.8%, a difference of 0.21%).
| Demographics | Rating | Rank | Hearing Disability |
| Immigrants | Somalia | 95.5 /100 | #96 | Exceptional 2.8% |
| Immigrants | Afghanistan | 95.3 /100 | #97 | Exceptional 2.8% |
| Immigrants | Honduras | 95.1 /100 | #98 | Exceptional 2.8% |
| Immigrants | Guatemala | 95.1 /100 | #99 | Exceptional 2.8% |
| Immigrants | Eastern Africa | 95.0 /100 | #100 | Exceptional 2.8% |
| Immigrants | Spain | 94.9 /100 | #101 | Exceptional 2.8% |
| Taiwanese | 94.8 /100 | #102 | Exceptional 2.8% |
| Immigrants | Indonesia | 94.7 /100 | #103 | Exceptional 2.8% |
| Burmese | 94.2 /100 | #104 | Exceptional 2.8% |
| Moroccans | 93.9 /100 | #105 | Exceptional 2.8% |
| Hondurans | 93.4 /100 | #106 | Exceptional 2.8% |
| Immigrants | Chile | 93.4 /100 | #107 | Exceptional 2.8% |
| Guatemalans | 93.2 /100 | #108 | Exceptional 2.8% |
| Turks | 93.0 /100 | #109 | Exceptional 2.8% |
| Cypriots | 92.9 /100 | #110 | Exceptional 2.8% |