Black/African American vs South American Hearing Disability
COMPARE
Black/African American
South American
Hearing Disability
Hearing Disability Comparison
Blacks/African Americans
South Americans
3.0%
HEARING DISABILITY
34.7/ 100
METRIC RATING
187th/ 347
METRIC RANK
2.7%
HEARING DISABILITY
99.0/ 100
METRIC RATING
57th/ 347
METRIC RANK
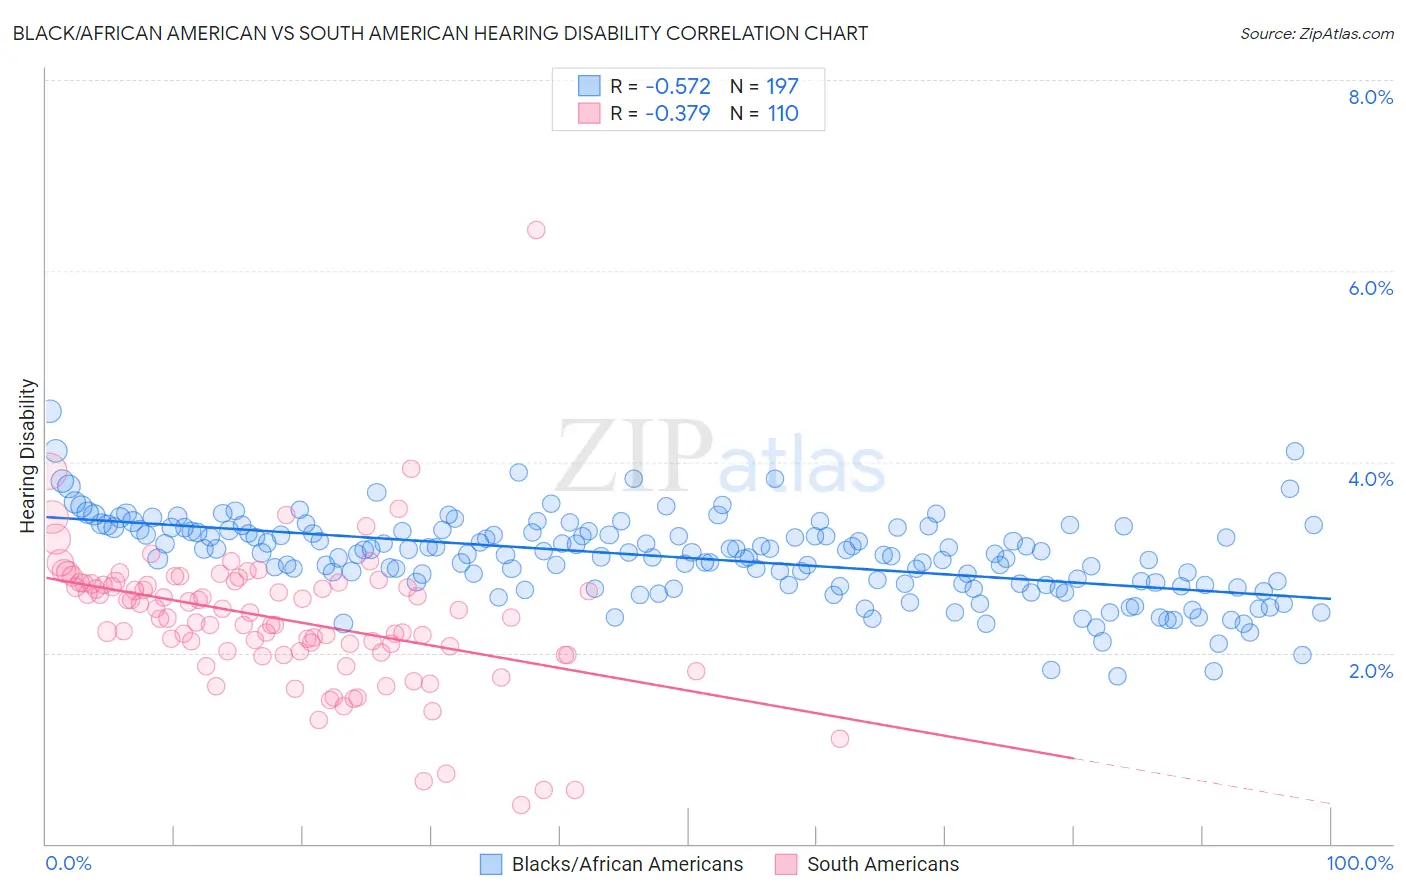
Black/African American vs South American Hearing Disability Correlation Chart
The statistical analysis conducted on geographies consisting of 565,046,012 people shows a substantial negative correlation between the proportion of Blacks/African Americans and percentage of population with hearing disability in the United States with a correlation coefficient (R) of -0.572 and weighted average of 3.0%. Similarly, the statistical analysis conducted on geographies consisting of 493,776,851 people shows a mild negative correlation between the proportion of South Americans and percentage of population with hearing disability in the United States with a correlation coefficient (R) of -0.379 and weighted average of 2.7%, a difference of 13.6%.
Hearing Disability Correlation Summary
| Measurement | Black/African American | South American |
| Minimum | 1.7% | 0.40% |
| Maximum | 4.5% | 6.4% |
| Range | 2.8% | 6.0% |
| Mean | 3.0% | 2.4% |
| Median | 3.0% | 2.4% |
| Interquartile 25% (IQ1) | 2.7% | 2.0% |
| Interquartile 75% (IQ3) | 3.3% | 2.7% |
| Interquartile Range (IQR) | 0.56% | 0.71% |
| Standard Deviation (Sample) | 0.43% | 0.75% |
| Standard Deviation (Population) | 0.43% | 0.75% |
Similar Demographics by Hearing Disability
Demographics Similar to Blacks/African Americans by Hearing Disability
In terms of hearing disability, the demographic groups most similar to Blacks/African Americans are Immigrants from Mexico (3.0%, a difference of 0.010%), Mexican American Indian (3.0%, a difference of 0.010%), Immigrants from Southern Europe (3.0%, a difference of 0.060%), African (3.0%, a difference of 0.19%), and Immigrants from Ireland (3.0%, a difference of 0.27%).
| Demographics | Rating | Rank | Hearing Disability |
| Immigrants | Sweden | 42.4 /100 | #180 | Average 3.0% |
| Immigrants | Belgium | 41.5 /100 | #181 | Average 3.0% |
| Immigrants | Italy | 41.1 /100 | #182 | Average 3.0% |
| Bulgarians | 39.7 /100 | #183 | Fair 3.0% |
| Immigrants | Ireland | 37.4 /100 | #184 | Fair 3.0% |
| Immigrants | Southern Europe | 35.3 /100 | #185 | Fair 3.0% |
| Immigrants | Mexico | 34.9 /100 | #186 | Fair 3.0% |
| Blacks/African Americans | 34.7 /100 | #187 | Fair 3.0% |
| Mexican American Indians | 34.7 /100 | #188 | Fair 3.0% |
| Africans | 32.9 /100 | #189 | Fair 3.0% |
| Immigrants | South Africa | 31.1 /100 | #190 | Fair 3.1% |
| Immigrants | Switzerland | 28.8 /100 | #191 | Fair 3.1% |
| Koreans | 27.6 /100 | #192 | Fair 3.1% |
| Macedonians | 27.0 /100 | #193 | Fair 3.1% |
| South Africans | 24.5 /100 | #194 | Fair 3.1% |
Demographics Similar to South Americans by Hearing Disability
In terms of hearing disability, the demographic groups most similar to South Americans are Immigrants from Nicaragua (2.7%, a difference of 0.040%), Immigrants from Ethiopia (2.7%, a difference of 0.070%), Ethiopian (2.7%, a difference of 0.13%), Immigrants from Eastern Asia (2.7%, a difference of 0.16%), and Jamaican (2.7%, a difference of 0.23%).
| Demographics | Rating | Rank | Hearing Disability |
| Paraguayans | 99.2 /100 | #50 | Exceptional 2.7% |
| Immigrants | Hong Kong | 99.2 /100 | #51 | Exceptional 2.7% |
| Jamaicans | 99.0 /100 | #52 | Exceptional 2.7% |
| Immigrants | Eastern Asia | 99.0 /100 | #53 | Exceptional 2.7% |
| Ethiopians | 99.0 /100 | #54 | Exceptional 2.7% |
| Immigrants | Ethiopia | 99.0 /100 | #55 | Exceptional 2.7% |
| Immigrants | Nicaragua | 99.0 /100 | #56 | Exceptional 2.7% |
| South Americans | 99.0 /100 | #57 | Exceptional 2.7% |
| Immigrants | Peru | 98.6 /100 | #58 | Exceptional 2.7% |
| Immigrants | Eritrea | 98.5 /100 | #59 | Exceptional 2.7% |
| Immigrants | Egypt | 98.5 /100 | #60 | Exceptional 2.7% |
| Immigrants | Uzbekistan | 98.4 /100 | #61 | Exceptional 2.7% |
| Immigrants | Colombia | 98.4 /100 | #62 | Exceptional 2.7% |
| Indians (Asian) | 98.4 /100 | #63 | Exceptional 2.7% |
| Immigrants | Sri Lanka | 98.4 /100 | #64 | Exceptional 2.7% |