Barbadian vs Puget Sound Salish Vision Disability
COMPARE
Barbadian
Puget Sound Salish
Vision Disability
Vision Disability Comparison
Barbadians
Puget Sound Salish
2.3%
VISION DISABILITY
5.1/ 100
METRIC RATING
217th/ 347
METRIC RANK
2.5%
VISION DISABILITY
0.0/ 100
METRIC RATING
283rd/ 347
METRIC RANK
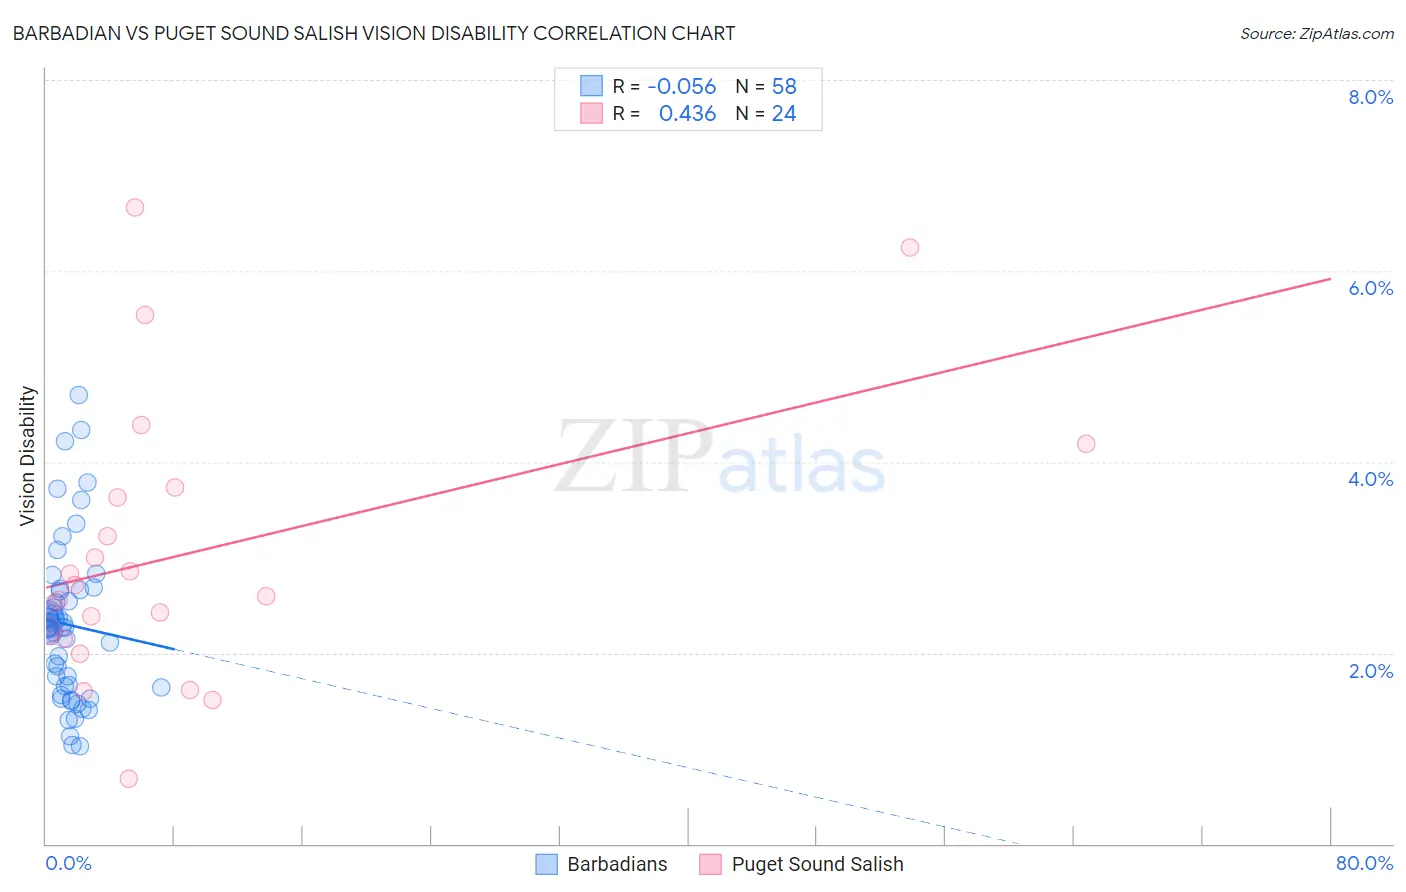
Barbadian vs Puget Sound Salish Vision Disability Correlation Chart
The statistical analysis conducted on geographies consisting of 141,266,636 people shows a slight negative correlation between the proportion of Barbadians and percentage of population with vision disability in the United States with a correlation coefficient (R) of -0.056 and weighted average of 2.3%. Similarly, the statistical analysis conducted on geographies consisting of 46,150,765 people shows a moderate positive correlation between the proportion of Puget Sound Salish and percentage of population with vision disability in the United States with a correlation coefficient (R) of 0.436 and weighted average of 2.5%, a difference of 8.5%.
Vision Disability Correlation Summary
| Measurement | Barbadian | Puget Sound Salish |
| Minimum | 1.0% | 0.69% |
| Maximum | 4.7% | 6.7% |
| Range | 3.7% | 6.0% |
| Mean | 2.3% | 3.1% |
| Median | 2.3% | 2.6% |
| Interquartile 25% (IQ1) | 1.6% | 2.2% |
| Interquartile 75% (IQ3) | 2.6% | 3.7% |
| Interquartile Range (IQR) | 1.0% | 1.5% |
| Standard Deviation (Sample) | 0.81% | 1.5% |
| Standard Deviation (Population) | 0.81% | 1.4% |
Similar Demographics by Vision Disability
Demographics Similar to Barbadians by Vision Disability
In terms of vision disability, the demographic groups most similar to Barbadians are Portuguese (2.3%, a difference of 0.070%), Ecuadorian (2.3%, a difference of 0.17%), Immigrants from Trinidad and Tobago (2.3%, a difference of 0.28%), Guamanian/Chamorro (2.3%, a difference of 0.41%), and French Canadian (2.3%, a difference of 0.43%).
| Demographics | Rating | Rank | Vision Disability |
| Immigrants | Uruguay | 11.5 /100 | #210 | Poor 2.2% |
| Indonesians | 9.5 /100 | #211 | Tragic 2.2% |
| Bermudans | 9.0 /100 | #212 | Tragic 2.2% |
| Immigrants | Ghana | 8.9 /100 | #213 | Tragic 2.2% |
| Trinidadians and Tobagonians | 8.2 /100 | #214 | Tragic 2.2% |
| Nigerians | 7.2 /100 | #215 | Tragic 2.3% |
| Immigrants | Trinidad and Tobago | 6.1 /100 | #216 | Tragic 2.3% |
| Barbadians | 5.1 /100 | #217 | Tragic 2.3% |
| Portuguese | 4.9 /100 | #218 | Tragic 2.3% |
| Ecuadorians | 4.6 /100 | #219 | Tragic 2.3% |
| Guamanians/Chamorros | 3.9 /100 | #220 | Tragic 2.3% |
| French Canadians | 3.9 /100 | #221 | Tragic 2.3% |
| Immigrants | Senegal | 3.8 /100 | #222 | Tragic 2.3% |
| Basques | 3.5 /100 | #223 | Tragic 2.3% |
| Irish | 3.4 /100 | #224 | Tragic 2.3% |
Demographics Similar to Puget Sound Salish by Vision Disability
In terms of vision disability, the demographic groups most similar to Puget Sound Salish are Immigrants from Caribbean (2.5%, a difference of 0.13%), U.S. Virgin Islander (2.5%, a difference of 0.25%), Yakama (2.5%, a difference of 0.28%), Immigrants from Central America (2.5%, a difference of 0.30%), and Sioux (2.5%, a difference of 0.31%).
| Demographics | Rating | Rank | Vision Disability |
| Scotch-Irish | 0.0 /100 | #276 | Tragic 2.4% |
| Bahamians | 0.0 /100 | #277 | Tragic 2.4% |
| Spanish | 0.0 /100 | #278 | Tragic 2.4% |
| Nepalese | 0.0 /100 | #279 | Tragic 2.4% |
| Cape Verdeans | 0.0 /100 | #280 | Tragic 2.4% |
| U.S. Virgin Islanders | 0.0 /100 | #281 | Tragic 2.5% |
| Immigrants | Caribbean | 0.0 /100 | #282 | Tragic 2.5% |
| Puget Sound Salish | 0.0 /100 | #283 | Tragic 2.5% |
| Yakama | 0.0 /100 | #284 | Tragic 2.5% |
| Immigrants | Central America | 0.0 /100 | #285 | Tragic 2.5% |
| Sioux | 0.0 /100 | #286 | Tragic 2.5% |
| Hondurans | 0.0 /100 | #287 | Tragic 2.5% |
| French American Indians | 0.0 /100 | #288 | Tragic 2.5% |
| Immigrants | Nonimmigrants | 0.0 /100 | #289 | Tragic 2.5% |
| Immigrants | Cuba | 0.0 /100 | #290 | Tragic 2.5% |