Black/African American vs Estonian Vision Disability
COMPARE
Black/African American
Estonian
Vision Disability
Vision Disability Comparison
Blacks/African Americans
Estonians
2.8%
VISION DISABILITY
0.0/ 100
METRIC RATING
320th/ 347
METRIC RANK
2.1%
VISION DISABILITY
95.3/ 100
METRIC RATING
99th/ 347
METRIC RANK
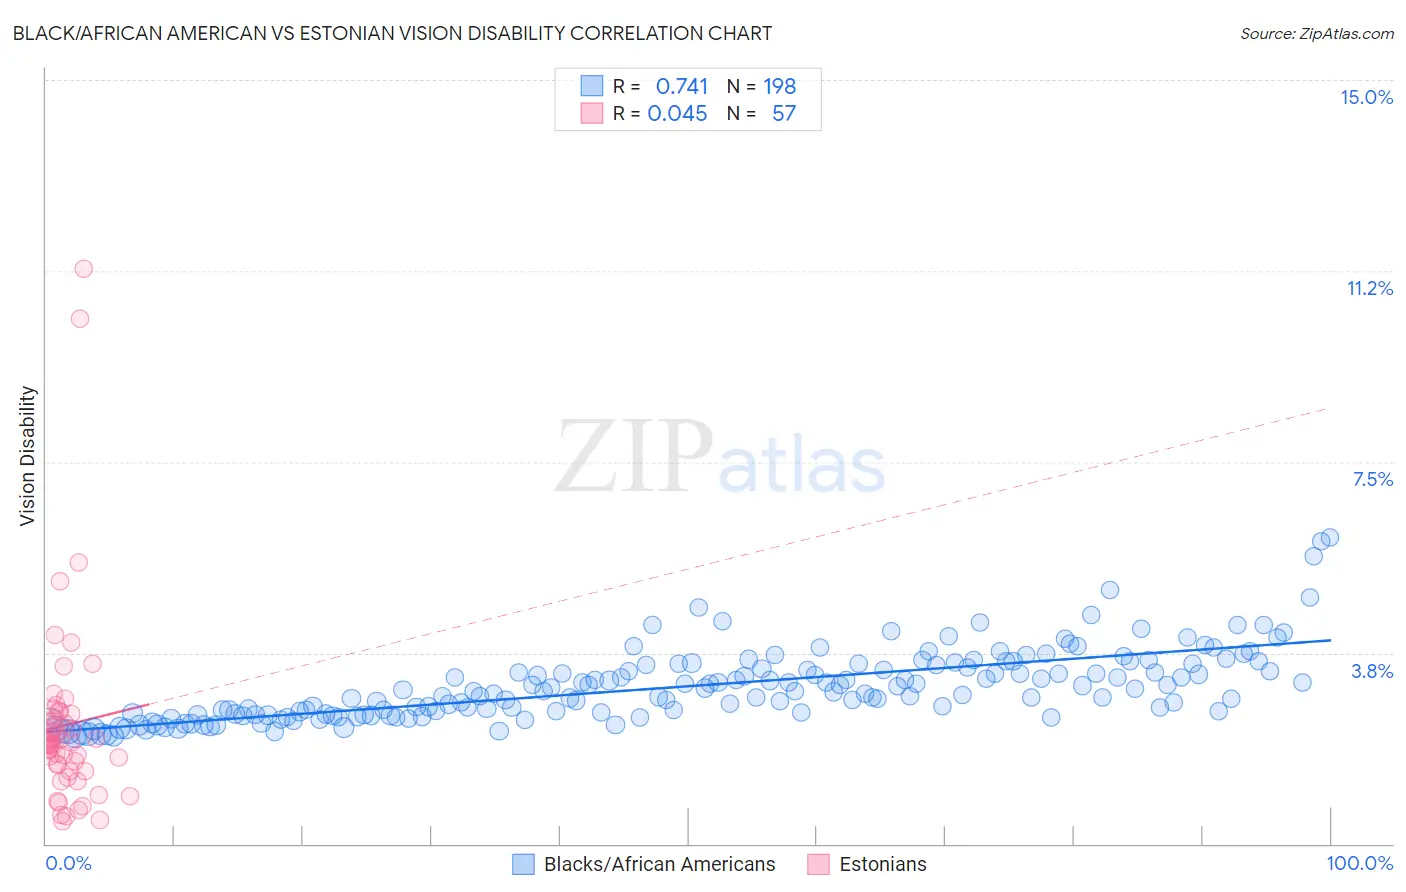
Black/African American vs Estonian Vision Disability Correlation Chart
The statistical analysis conducted on geographies consisting of 564,452,359 people shows a strong positive correlation between the proportion of Blacks/African Americans and percentage of population with vision disability in the United States with a correlation coefficient (R) of 0.741 and weighted average of 2.8%. Similarly, the statistical analysis conducted on geographies consisting of 123,516,084 people shows no correlation between the proportion of Estonians and percentage of population with vision disability in the United States with a correlation coefficient (R) of 0.045 and weighted average of 2.1%, a difference of 35.0%.
Vision Disability Correlation Summary
| Measurement | Black/African American | Estonian |
| Minimum | 2.1% | 0.45% |
| Maximum | 6.0% | 11.3% |
| Range | 3.9% | 10.8% |
| Mean | 3.1% | 2.3% |
| Median | 3.0% | 2.0% |
| Interquartile 25% (IQ1) | 2.5% | 1.4% |
| Interquartile 75% (IQ3) | 3.5% | 2.6% |
| Interquartile Range (IQR) | 0.91% | 1.1% |
| Standard Deviation (Sample) | 0.70% | 1.9% |
| Standard Deviation (Population) | 0.70% | 1.9% |
Similar Demographics by Vision Disability
Demographics Similar to Blacks/African Americans by Vision Disability
In terms of vision disability, the demographic groups most similar to Blacks/African Americans are Tohono O'odham (2.8%, a difference of 0.69%), Comanche (2.8%, a difference of 2.0%), Alaska Native (2.7%, a difference of 2.1%), Paiute (2.9%, a difference of 2.5%), and Tlingit-Haida (2.9%, a difference of 2.5%).
| Demographics | Rating | Rank | Vision Disability |
| Potawatomi | 0.0 /100 | #313 | Tragic 2.6% |
| Inupiat | 0.0 /100 | #314 | Tragic 2.7% |
| Osage | 0.0 /100 | #315 | Tragic 2.7% |
| Shoshone | 0.0 /100 | #316 | Tragic 2.7% |
| Yup'ik | 0.0 /100 | #317 | Tragic 2.7% |
| Alaska Natives | 0.0 /100 | #318 | Tragic 2.7% |
| Tohono O'odham | 0.0 /100 | #319 | Tragic 2.8% |
| Blacks/African Americans | 0.0 /100 | #320 | Tragic 2.8% |
| Comanche | 0.0 /100 | #321 | Tragic 2.8% |
| Paiute | 0.0 /100 | #322 | Tragic 2.9% |
| Tlingit-Haida | 0.0 /100 | #323 | Tragic 2.9% |
| Hopi | 0.0 /100 | #324 | Tragic 2.9% |
| Cherokee | 0.0 /100 | #325 | Tragic 2.9% |
| Spanish Americans | 0.0 /100 | #326 | Tragic 2.9% |
| Natives/Alaskans | 0.0 /100 | #327 | Tragic 3.0% |
Demographics Similar to Estonians by Vision Disability
In terms of vision disability, the demographic groups most similar to Estonians are Greek (2.1%, a difference of 0.040%), Immigrants from South Africa (2.1%, a difference of 0.070%), Immigrants from Afghanistan (2.1%, a difference of 0.12%), Albanian (2.1%, a difference of 0.12%), and Sri Lankan (2.1%, a difference of 0.15%).
| Demographics | Rating | Rank | Vision Disability |
| Immigrants | Syria | 96.2 /100 | #92 | Exceptional 2.1% |
| Immigrants | Europe | 96.1 /100 | #93 | Exceptional 2.1% |
| Immigrants | Croatia | 96.0 /100 | #94 | Exceptional 2.1% |
| Australians | 95.9 /100 | #95 | Exceptional 2.1% |
| Romanians | 95.7 /100 | #96 | Exceptional 2.1% |
| Immigrants | Afghanistan | 95.6 /100 | #97 | Exceptional 2.1% |
| Immigrants | South Africa | 95.4 /100 | #98 | Exceptional 2.1% |
| Estonians | 95.3 /100 | #99 | Exceptional 2.1% |
| Greeks | 95.1 /100 | #100 | Exceptional 2.1% |
| Albanians | 94.9 /100 | #101 | Exceptional 2.1% |
| Sri Lankans | 94.8 /100 | #102 | Exceptional 2.1% |
| Immigrants | Austria | 94.4 /100 | #103 | Exceptional 2.1% |
| Immigrants | Italy | 94.4 /100 | #104 | Exceptional 2.1% |
| Carpatho Rusyns | 94.3 /100 | #105 | Exceptional 2.1% |
| Swedes | 94.2 /100 | #106 | Exceptional 2.1% |