Salvadoran vs Puget Sound Salish Vision Disability
COMPARE
Salvadoran
Puget Sound Salish
Vision Disability
Vision Disability Comparison
Salvadorans
Puget Sound Salish
2.2%
VISION DISABILITY
27.4/ 100
METRIC RATING
189th/ 347
METRIC RANK
2.5%
VISION DISABILITY
0.0/ 100
METRIC RATING
283rd/ 347
METRIC RANK
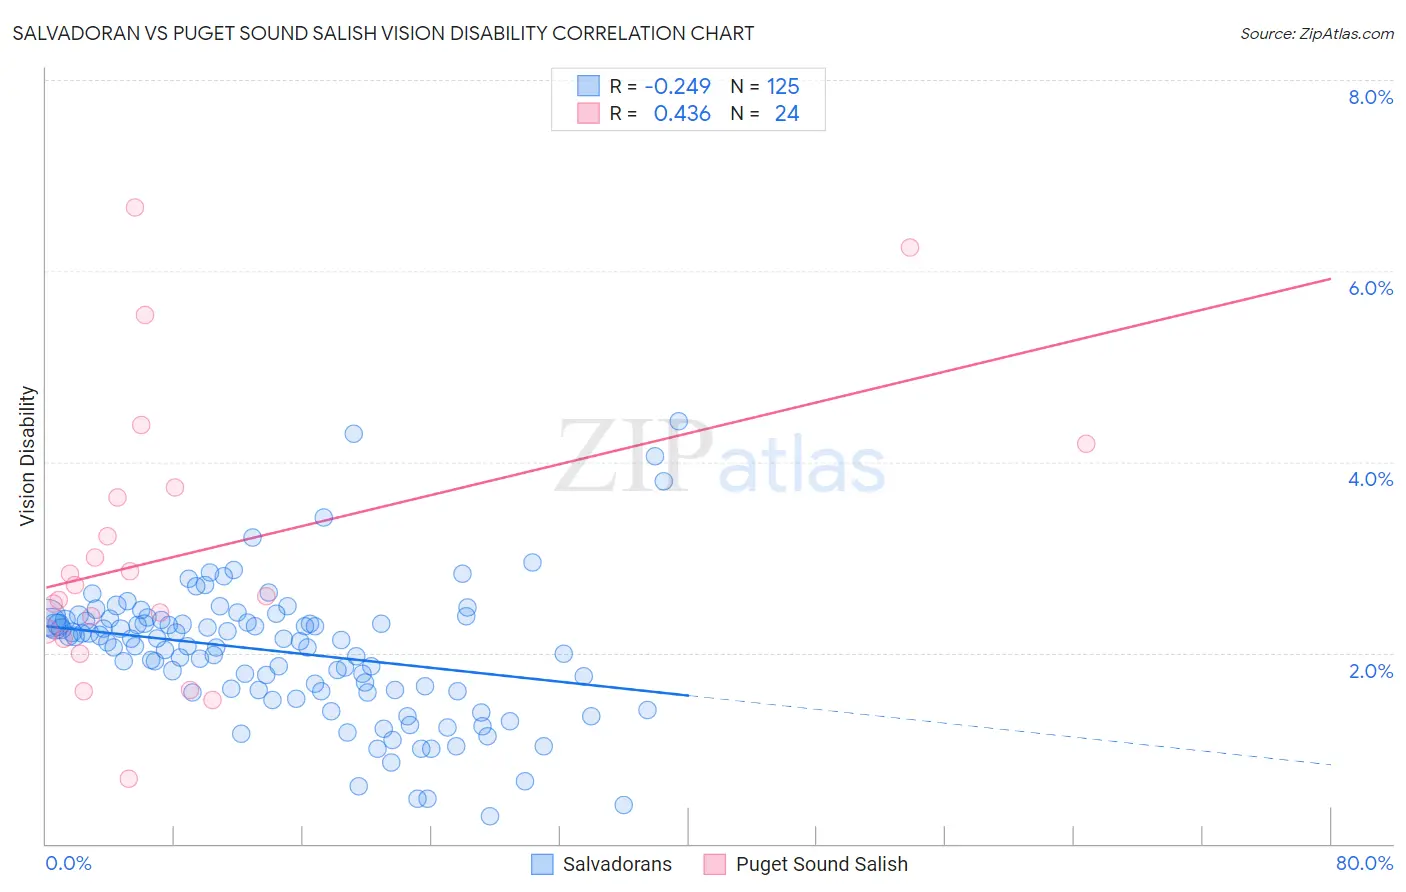
Salvadoran vs Puget Sound Salish Vision Disability Correlation Chart
The statistical analysis conducted on geographies consisting of 398,695,149 people shows a weak negative correlation between the proportion of Salvadorans and percentage of population with vision disability in the United States with a correlation coefficient (R) of -0.249 and weighted average of 2.2%. Similarly, the statistical analysis conducted on geographies consisting of 46,150,765 people shows a moderate positive correlation between the proportion of Puget Sound Salish and percentage of population with vision disability in the United States with a correlation coefficient (R) of 0.436 and weighted average of 2.5%, a difference of 11.8%.
Vision Disability Correlation Summary
| Measurement | Salvadoran | Puget Sound Salish |
| Minimum | 0.28% | 0.69% |
| Maximum | 4.4% | 6.7% |
| Range | 4.1% | 6.0% |
| Mean | 2.0% | 3.1% |
| Median | 2.1% | 2.6% |
| Interquartile 25% (IQ1) | 1.6% | 2.2% |
| Interquartile 75% (IQ3) | 2.3% | 3.7% |
| Interquartile Range (IQR) | 0.75% | 1.5% |
| Standard Deviation (Sample) | 0.72% | 1.5% |
| Standard Deviation (Population) | 0.71% | 1.4% |
Similar Demographics by Vision Disability
Demographics Similar to Salvadorans by Vision Disability
In terms of vision disability, the demographic groups most similar to Salvadorans are Guyanese (2.2%, a difference of 0.11%), Immigrants from Costa Rica (2.2%, a difference of 0.11%), Canadian (2.2%, a difference of 0.13%), European (2.2%, a difference of 0.13%), and British (2.2%, a difference of 0.19%).
| Demographics | Rating | Rank | Vision Disability |
| Costa Ricans | 40.7 /100 | #182 | Average 2.2% |
| Immigrants | Burma/Myanmar | 37.9 /100 | #183 | Fair 2.2% |
| Moroccans | 35.4 /100 | #184 | Fair 2.2% |
| Immigrants | Middle Africa | 33.5 /100 | #185 | Fair 2.2% |
| Native Hawaiians | 33.3 /100 | #186 | Fair 2.2% |
| Immigrants | St. Vincent and the Grenadines | 30.3 /100 | #187 | Fair 2.2% |
| Guyanese | 28.9 /100 | #188 | Fair 2.2% |
| Salvadorans | 27.4 /100 | #189 | Fair 2.2% |
| Immigrants | Costa Rica | 26.1 /100 | #190 | Fair 2.2% |
| Canadians | 25.8 /100 | #191 | Fair 2.2% |
| Europeans | 25.7 /100 | #192 | Fair 2.2% |
| British | 25.1 /100 | #193 | Fair 2.2% |
| Immigrants | Barbados | 24.0 /100 | #194 | Fair 2.2% |
| Immigrants | Immigrants | 23.7 /100 | #195 | Fair 2.2% |
| Immigrants | Grenada | 23.1 /100 | #196 | Fair 2.2% |
Demographics Similar to Puget Sound Salish by Vision Disability
In terms of vision disability, the demographic groups most similar to Puget Sound Salish are Immigrants from Caribbean (2.5%, a difference of 0.13%), U.S. Virgin Islander (2.5%, a difference of 0.25%), Yakama (2.5%, a difference of 0.28%), Immigrants from Central America (2.5%, a difference of 0.30%), and Sioux (2.5%, a difference of 0.31%).
| Demographics | Rating | Rank | Vision Disability |
| Scotch-Irish | 0.0 /100 | #276 | Tragic 2.4% |
| Bahamians | 0.0 /100 | #277 | Tragic 2.4% |
| Spanish | 0.0 /100 | #278 | Tragic 2.4% |
| Nepalese | 0.0 /100 | #279 | Tragic 2.4% |
| Cape Verdeans | 0.0 /100 | #280 | Tragic 2.4% |
| U.S. Virgin Islanders | 0.0 /100 | #281 | Tragic 2.5% |
| Immigrants | Caribbean | 0.0 /100 | #282 | Tragic 2.5% |
| Puget Sound Salish | 0.0 /100 | #283 | Tragic 2.5% |
| Yakama | 0.0 /100 | #284 | Tragic 2.5% |
| Immigrants | Central America | 0.0 /100 | #285 | Tragic 2.5% |
| Sioux | 0.0 /100 | #286 | Tragic 2.5% |
| Hondurans | 0.0 /100 | #287 | Tragic 2.5% |
| French American Indians | 0.0 /100 | #288 | Tragic 2.5% |
| Immigrants | Nonimmigrants | 0.0 /100 | #289 | Tragic 2.5% |
| Immigrants | Cuba | 0.0 /100 | #290 | Tragic 2.5% |