Black/African American vs Immigrants from Spain No Schooling Completed
COMPARE
Black/African American
Immigrants from Spain
No Schooling Completed
No Schooling Completed Comparison
Blacks/African Americans
Immigrants from Spain
2.1%
NO SCHOOLING COMPLETED
41.4/ 100
METRIC RATING
183rd/ 347
METRIC RANK
2.0%
NO SCHOOLING COMPLETED
66.4/ 100
METRIC RATING
159th/ 347
METRIC RANK
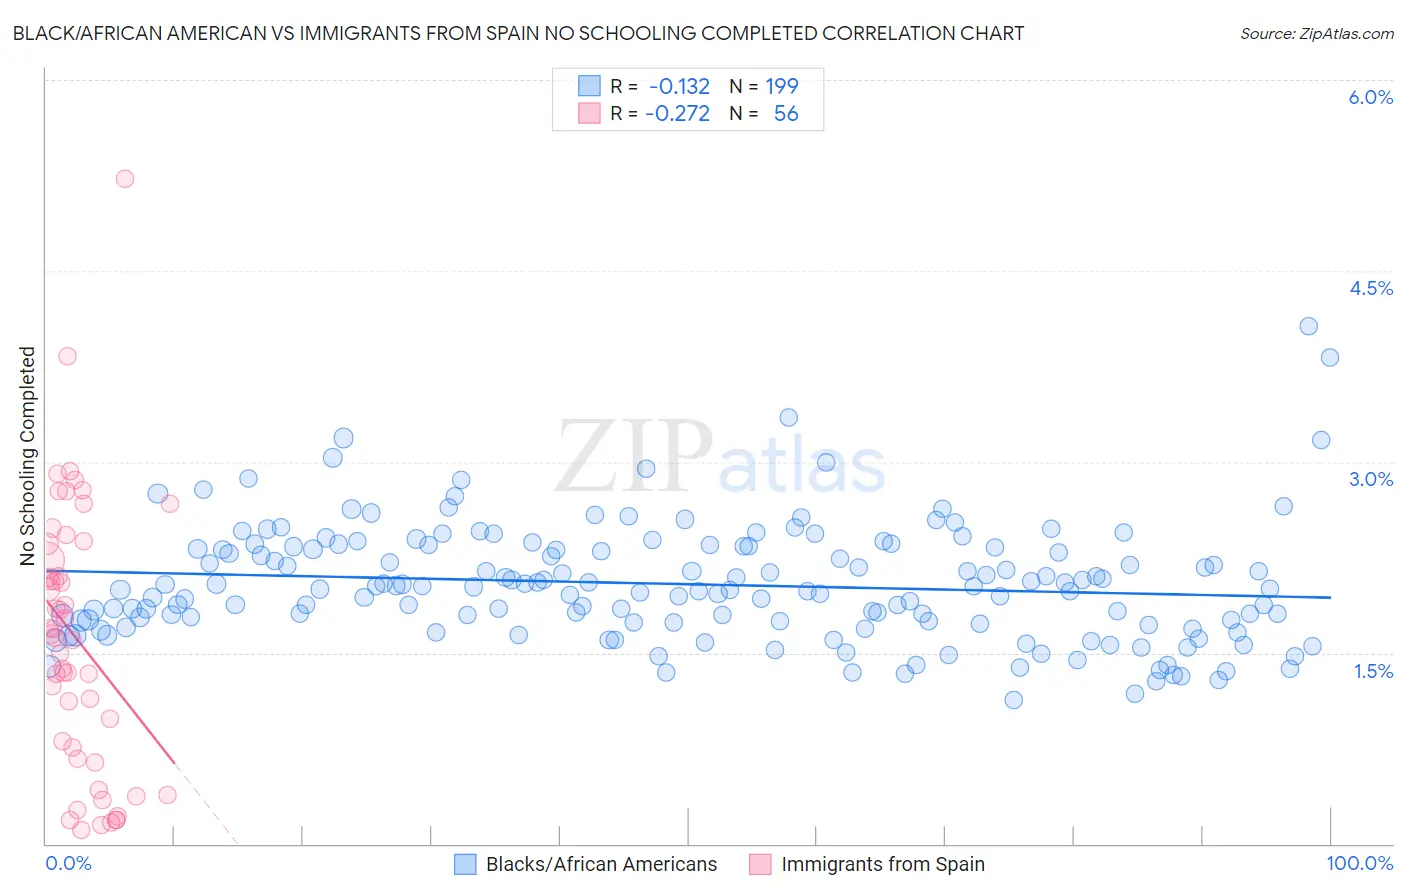
Black/African American vs Immigrants from Spain No Schooling Completed Correlation Chart
The statistical analysis conducted on geographies consisting of 551,024,391 people shows a poor negative correlation between the proportion of Blacks/African Americans and percentage of population with no schooling in the United States with a correlation coefficient (R) of -0.132 and weighted average of 2.1%. Similarly, the statistical analysis conducted on geographies consisting of 238,284,767 people shows a weak negative correlation between the proportion of Immigrants from Spain and percentage of population with no schooling in the United States with a correlation coefficient (R) of -0.272 and weighted average of 2.0%, a difference of 3.5%.
No Schooling Completed Correlation Summary
| Measurement | Black/African American | Immigrants from Spain |
| Minimum | 1.1% | 0.11% |
| Maximum | 4.1% | 5.2% |
| Range | 2.9% | 5.1% |
| Mean | 2.0% | 1.6% |
| Median | 2.0% | 1.6% |
| Interquartile 25% (IQ1) | 1.7% | 0.72% |
| Interquartile 75% (IQ3) | 2.3% | 2.3% |
| Interquartile Range (IQR) | 0.59% | 1.6% |
| Standard Deviation (Sample) | 0.46% | 1.0% |
| Standard Deviation (Population) | 0.46% | 1.0% |
Similar Demographics by No Schooling Completed
Demographics Similar to Blacks/African Americans by No Schooling Completed
In terms of no schooling completed, the demographic groups most similar to Blacks/African Americans are Pima (2.1%, a difference of 0.020%), Mongolian (2.1%, a difference of 0.090%), French American Indian (2.1%, a difference of 0.10%), Immigrants from Taiwan (2.1%, a difference of 0.15%), and Portuguese (2.1%, a difference of 0.33%).
| Demographics | Rating | Rank | No Schooling Completed |
| Panamanians | 45.2 /100 | #176 | Average 2.1% |
| Arapaho | 45.0 /100 | #177 | Average 2.1% |
| Pakistanis | 44.7 /100 | #178 | Average 2.1% |
| Immigrants | Kazakhstan | 44.3 /100 | #179 | Average 2.1% |
| Portuguese | 43.9 /100 | #180 | Average 2.1% |
| Immigrants | Taiwan | 42.6 /100 | #181 | Average 2.1% |
| French American Indians | 42.2 /100 | #182 | Average 2.1% |
| Blacks/African Americans | 41.4 /100 | #183 | Average 2.1% |
| Pima | 41.3 /100 | #184 | Average 2.1% |
| Mongolians | 40.8 /100 | #185 | Average 2.1% |
| Immigrants | Bosnia and Herzegovina | 38.6 /100 | #186 | Fair 2.1% |
| Navajo | 36.5 /100 | #187 | Fair 2.1% |
| Immigrants | Kenya | 36.2 /100 | #188 | Fair 2.1% |
| Immigrants | Egypt | 36.1 /100 | #189 | Fair 2.1% |
| Spanish Americans | 32.6 /100 | #190 | Fair 2.1% |
Demographics Similar to Immigrants from Spain by No Schooling Completed
In terms of no schooling completed, the demographic groups most similar to Immigrants from Spain are Immigrants from Korea (2.0%, a difference of 0.050%), Immigrants from Sri Lanka (2.0%, a difference of 0.090%), Chilean (2.0%, a difference of 0.12%), Kenyan (2.0%, a difference of 0.12%), and Immigrants from Russia (2.0%, a difference of 0.19%).
| Demographics | Rating | Rank | No Schooling Completed |
| Immigrants | Eastern Europe | 70.4 /100 | #152 | Good 2.0% |
| Immigrants | Italy | 68.9 /100 | #153 | Good 2.0% |
| Immigrants | Venezuela | 68.5 /100 | #154 | Good 2.0% |
| Immigrants | Russia | 67.6 /100 | #155 | Good 2.0% |
| Chileans | 67.2 /100 | #156 | Good 2.0% |
| Immigrants | Sri Lanka | 67.0 /100 | #157 | Good 2.0% |
| Immigrants | Korea | 66.7 /100 | #158 | Good 2.0% |
| Immigrants | Spain | 66.4 /100 | #159 | Good 2.0% |
| Kenyans | 65.7 /100 | #160 | Good 2.0% |
| Ugandans | 64.6 /100 | #161 | Good 2.0% |
| Immigrants | Brazil | 63.8 /100 | #162 | Good 2.1% |
| Albanians | 62.2 /100 | #163 | Good 2.1% |
| Comanche | 60.7 /100 | #164 | Good 2.1% |
| Brazilians | 60.2 /100 | #165 | Good 2.1% |
| Dutch West Indians | 59.9 /100 | #166 | Average 2.1% |