Cajun vs Bahamian Cognitive Disability
COMPARE
Cajun
Bahamian
Cognitive Disability
Cognitive Disability Comparison
Cajuns
Bahamians
17.8%
COGNITIVE DISABILITY
1.4/ 100
METRIC RATING
239th/ 347
METRIC RANK
17.9%
COGNITIVE DISABILITY
0.6/ 100
METRIC RATING
256th/ 347
METRIC RANK
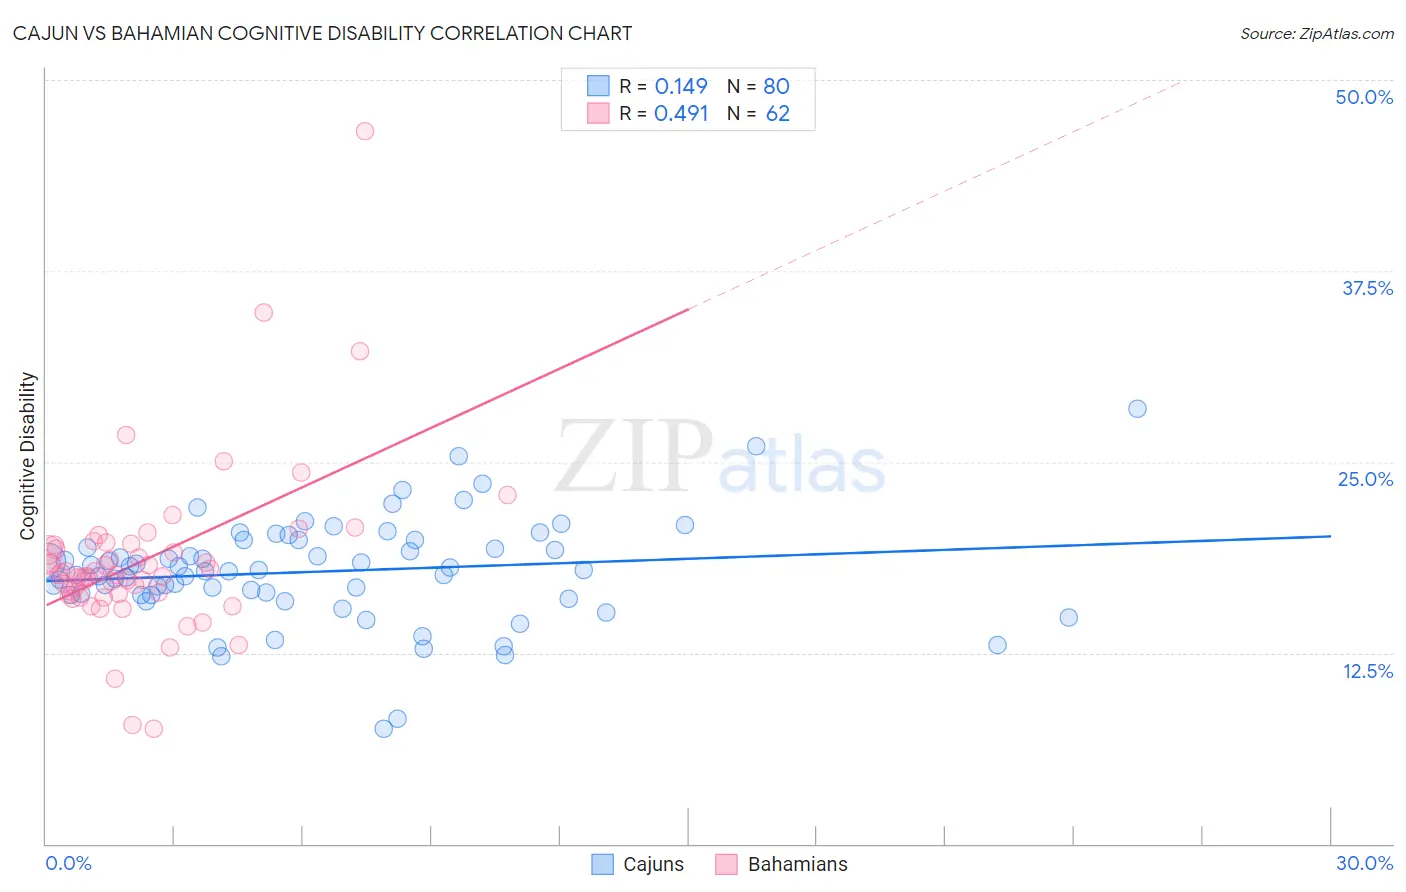
Cajun vs Bahamian Cognitive Disability Correlation Chart
The statistical analysis conducted on geographies consisting of 149,701,580 people shows a poor positive correlation between the proportion of Cajuns and percentage of population with cognitive disability in the United States with a correlation coefficient (R) of 0.149 and weighted average of 17.8%. Similarly, the statistical analysis conducted on geographies consisting of 112,674,908 people shows a moderate positive correlation between the proportion of Bahamians and percentage of population with cognitive disability in the United States with a correlation coefficient (R) of 0.491 and weighted average of 17.9%, a difference of 0.59%.
Cognitive Disability Correlation Summary
| Measurement | Cajun | Bahamian |
| Minimum | 7.5% | 7.5% |
| Maximum | 28.5% | 46.6% |
| Range | 20.9% | 39.1% |
| Mean | 17.8% | 18.6% |
| Median | 17.9% | 17.6% |
| Interquartile 25% (IQ1) | 16.3% | 16.4% |
| Interquartile 75% (IQ3) | 19.6% | 19.6% |
| Interquartile Range (IQR) | 3.4% | 3.2% |
| Standard Deviation (Sample) | 3.4% | 5.6% |
| Standard Deviation (Population) | 3.4% | 5.6% |
Demographics Similar to Cajuns and Bahamians by Cognitive Disability
In terms of cognitive disability, the demographic groups most similar to Cajuns are Iraqi (17.8%, a difference of 0.040%), Cheyenne (17.8%, a difference of 0.13%), Immigrants from Mexico (17.8%, a difference of 0.16%), Mexican (17.8%, a difference of 0.18%), and Paiute (17.8%, a difference of 0.19%). Similarly, the demographic groups most similar to Bahamians are Immigrants from the Azores (17.9%, a difference of 0.0%), Hopi (17.9%, a difference of 0.010%), Hispanic or Latino (17.9%, a difference of 0.010%), Immigrants from Grenada (17.9%, a difference of 0.020%), and Malaysian (17.9%, a difference of 0.030%).
| Demographics | Rating | Rank | Cognitive Disability |
| Immigrants | Mexico | 1.8 /100 | #237 | Tragic 17.8% |
| Cheyenne | 1.7 /100 | #238 | Tragic 17.8% |
| Cajuns | 1.4 /100 | #239 | Tragic 17.8% |
| Iraqis | 1.4 /100 | #240 | Tragic 17.8% |
| Mexicans | 1.1 /100 | #241 | Tragic 17.8% |
| Paiute | 1.1 /100 | #242 | Tragic 17.8% |
| Immigrants | Bangladesh | 1.0 /100 | #243 | Tragic 17.8% |
| Jamaicans | 0.9 /100 | #244 | Tragic 17.9% |
| Trinidadians and Tobagonians | 0.8 /100 | #245 | Tragic 17.9% |
| Immigrants | Thailand | 0.8 /100 | #246 | Tragic 17.9% |
| Samoans | 0.7 /100 | #247 | Tragic 17.9% |
| French American Indians | 0.7 /100 | #248 | Tragic 17.9% |
| Cree | 0.7 /100 | #249 | Tragic 17.9% |
| Immigrants | Ethiopia | 0.7 /100 | #250 | Tragic 17.9% |
| Malaysians | 0.6 /100 | #251 | Tragic 17.9% |
| Immigrants | Grenada | 0.6 /100 | #252 | Tragic 17.9% |
| Hopi | 0.6 /100 | #253 | Tragic 17.9% |
| Hispanics or Latinos | 0.6 /100 | #254 | Tragic 17.9% |
| Immigrants | Azores | 0.6 /100 | #255 | Tragic 17.9% |
| Bahamians | 0.6 /100 | #256 | Tragic 17.9% |
| Mexican American Indians | 0.6 /100 | #257 | Tragic 17.9% |