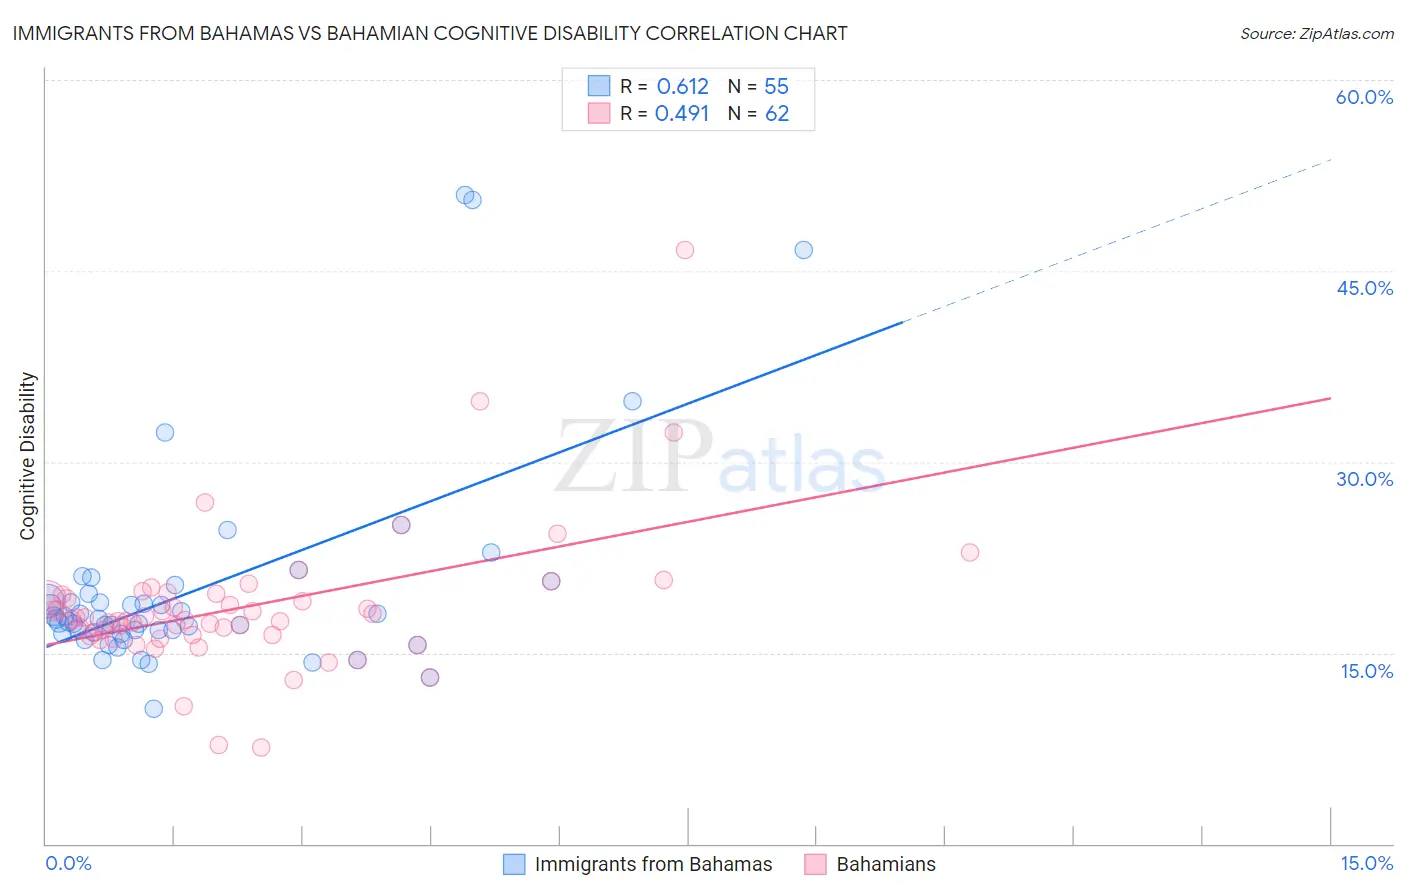
Immigrants from Bahamas vs Bahamian Cognitive Disability
COMPARE
Immigrants from Bahamas
Bahamian
Cognitive Disability
Cognitive Disability Comparison
Immigrants from Bahamas
Bahamians
18.0%
COGNITIVE DISABILITY
0.3/ 100
METRIC RATING
270th/ 347
METRIC RANK
17.9%
COGNITIVE DISABILITY
0.6/ 100
METRIC RATING
256th/ 347
METRIC RANK
Immigrants from Bahamas vs Bahamian Cognitive Disability Correlation Chart
The statistical analysis conducted on geographies consisting of 104,656,442 people shows a significant positive correlation between the proportion of Immigrants from Bahamas and percentage of population with cognitive disability in the United States with a correlation coefficient (R) of 0.612 and weighted average of 18.0%. Similarly, the statistical analysis conducted on geographies consisting of 112,674,908 people shows a moderate positive correlation between the proportion of Bahamians and percentage of population with cognitive disability in the United States with a correlation coefficient (R) of 0.491 and weighted average of 17.9%, a difference of 0.58%.
Cognitive Disability Correlation Summary
| Measurement | Immigrants from Bahamas | Bahamian |
| Minimum | 10.6% | 7.5% |
| Maximum | 51.0% | 46.6% |
| Range | 40.4% | 39.1% |
| Mean | 20.0% | 18.6% |
| Median | 17.6% | 17.6% |
| Interquartile 25% (IQ1) | 16.5% | 16.4% |
| Interquartile 75% (IQ3) | 19.6% | 19.6% |
| Interquartile Range (IQR) | 3.1% | 3.2% |
| Standard Deviation (Sample) | 8.2% | 5.6% |
| Standard Deviation (Population) | 8.1% | 5.6% |
Demographics Similar to Immigrants from Bahamas and Bahamians by Cognitive Disability
In terms of cognitive disability, the demographic groups most similar to Immigrants from Bahamas are Honduran (18.0%, a difference of 0.010%), Potawatomi (18.0%, a difference of 0.070%), Immigrants from Honduras (18.0%, a difference of 0.090%), Cherokee (18.0%, a difference of 0.15%), and Nepalese (18.0%, a difference of 0.16%). Similarly, the demographic groups most similar to Bahamians are Immigrants from the Azores (17.9%, a difference of 0.0%), Hopi (17.9%, a difference of 0.010%), Hispanic or Latino (17.9%, a difference of 0.010%), Mexican American Indian (17.9%, a difference of 0.040%), and Immigrants from Armenia (17.9%, a difference of 0.050%).
| Demographics | Rating | Rank | Cognitive Disability |
| Hopi | 0.6 /100 | #253 | Tragic 17.9% |
| Hispanics or Latinos | 0.6 /100 | #254 | Tragic 17.9% |
| Immigrants | Azores | 0.6 /100 | #255 | Tragic 17.9% |
| Bahamians | 0.6 /100 | #256 | Tragic 17.9% |
| Mexican American Indians | 0.6 /100 | #257 | Tragic 17.9% |
| Immigrants | Armenia | 0.6 /100 | #258 | Tragic 17.9% |
| Ethiopians | 0.5 /100 | #259 | Tragic 17.9% |
| Immigrants | Belize | 0.5 /100 | #260 | Tragic 17.9% |
| Guamanians/Chamorros | 0.5 /100 | #261 | Tragic 17.9% |
| Sierra Leoneans | 0.4 /100 | #262 | Tragic 17.9% |
| Immigrants | Barbados | 0.4 /100 | #263 | Tragic 17.9% |
| Menominee | 0.4 /100 | #264 | Tragic 18.0% |
| Spanish Americans | 0.4 /100 | #265 | Tragic 18.0% |
| Belizeans | 0.4 /100 | #266 | Tragic 18.0% |
| Nepalese | 0.3 /100 | #267 | Tragic 18.0% |
| Cherokee | 0.3 /100 | #268 | Tragic 18.0% |
| Hondurans | 0.3 /100 | #269 | Tragic 18.0% |
| Immigrants | Bahamas | 0.3 /100 | #270 | Tragic 18.0% |
| Potawatomi | 0.2 /100 | #271 | Tragic 18.0% |
| Immigrants | Honduras | 0.2 /100 | #272 | Tragic 18.0% |
| Immigrants | Nepal | 0.2 /100 | #273 | Tragic 18.0% |