Black/African American vs Bahamian In Labor Force | Age 45-54
COMPARE
Black/African American
Bahamian
In Labor Force | Age 45-54
In Labor Force | Age 45-54 Comparison
Blacks/African Americans
Bahamians
79.3%
IN LABOR FORCE | AGE 45-54
0.0/ 100
METRIC RATING
315th/ 347
METRIC RANK
82.2%
IN LABOR FORCE | AGE 45-54
3.6/ 100
METRIC RATING
220th/ 347
METRIC RANK
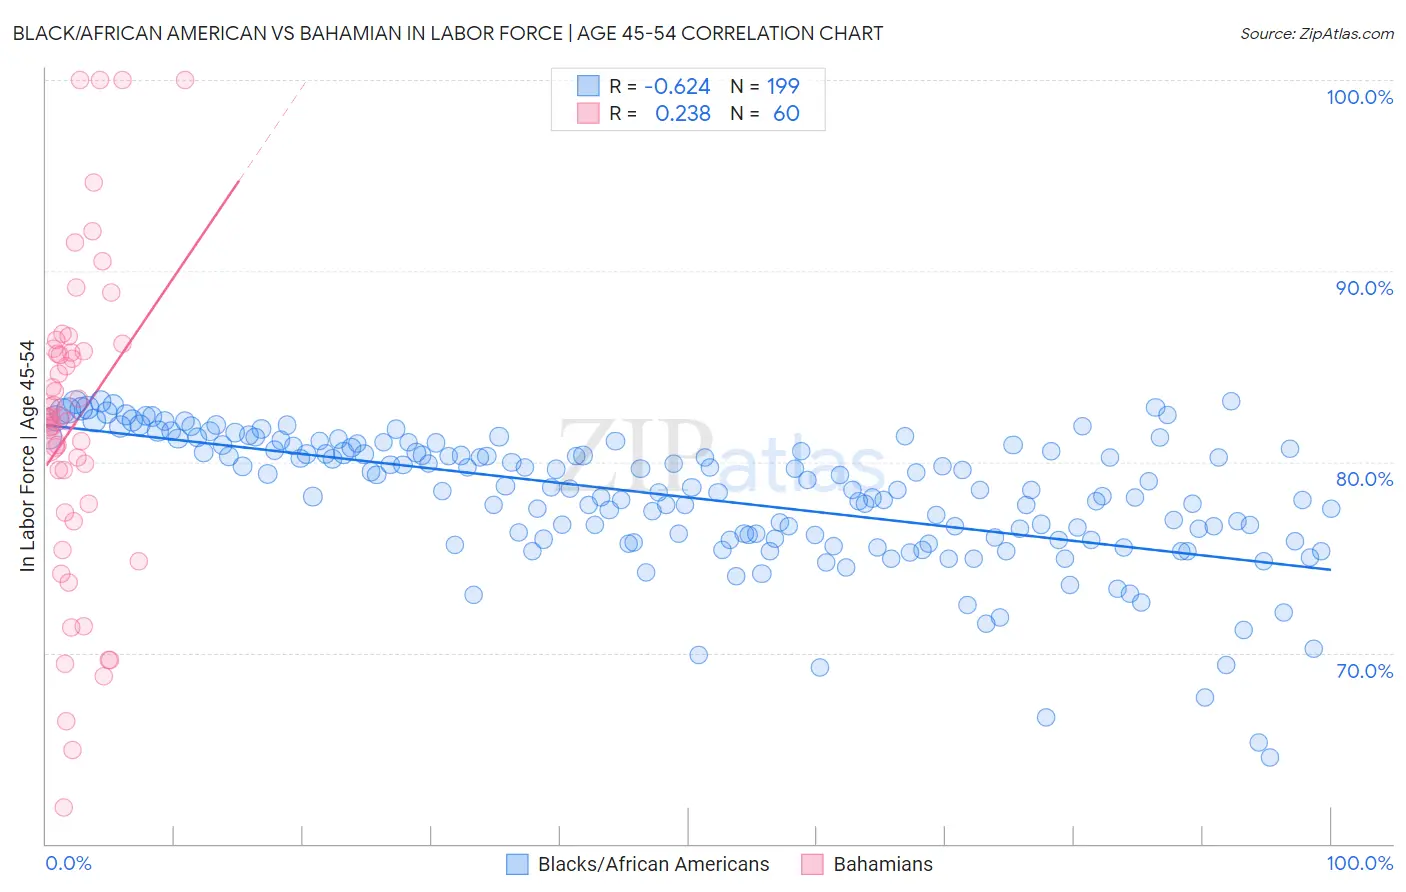
Black/African American vs Bahamian In Labor Force | Age 45-54 Correlation Chart
The statistical analysis conducted on geographies consisting of 565,123,910 people shows a significant negative correlation between the proportion of Blacks/African Americans and labor force participation rate among population between the ages 45 and 54 in the United States with a correlation coefficient (R) of -0.624 and weighted average of 79.3%. Similarly, the statistical analysis conducted on geographies consisting of 112,617,260 people shows a weak positive correlation between the proportion of Bahamians and labor force participation rate among population between the ages 45 and 54 in the United States with a correlation coefficient (R) of 0.238 and weighted average of 82.2%, a difference of 3.5%.
In Labor Force | Age 45-54 Correlation Summary
| Measurement | Black/African American | Bahamian |
| Minimum | 64.5% | 61.9% |
| Maximum | 83.2% | 100.0% |
| Range | 18.7% | 38.1% |
| Mean | 78.1% | 82.0% |
| Median | 78.6% | 82.3% |
| Interquartile 25% (IQ1) | 75.9% | 77.6% |
| Interquartile 75% (IQ3) | 80.8% | 85.9% |
| Interquartile Range (IQR) | 4.9% | 8.3% |
| Standard Deviation (Sample) | 3.5% | 8.4% |
| Standard Deviation (Population) | 3.5% | 8.3% |
Similar Demographics by In Labor Force | Age 45-54
Demographics Similar to Blacks/African Americans by In Labor Force | Age 45-54
In terms of in labor force | age 45-54, the demographic groups most similar to Blacks/African Americans are Shoshone (79.3%, a difference of 0.080%), Ottawa (79.5%, a difference of 0.14%), Colville (79.5%, a difference of 0.17%), Comanche (79.2%, a difference of 0.22%), and Chickasaw (79.0%, a difference of 0.39%).
| Demographics | Rating | Rank | In Labor Force | Age 45-54 |
| Central American Indians | 0.0 /100 | #308 | Tragic 80.0% |
| Potawatomi | 0.0 /100 | #309 | Tragic 80.0% |
| Inupiat | 0.0 /100 | #310 | Tragic 79.9% |
| Mexicans | 0.0 /100 | #311 | Tragic 79.8% |
| Immigrants | Mexico | 0.0 /100 | #312 | Tragic 79.7% |
| Colville | 0.0 /100 | #313 | Tragic 79.5% |
| Ottawa | 0.0 /100 | #314 | Tragic 79.5% |
| Blacks/African Americans | 0.0 /100 | #315 | Tragic 79.3% |
| Shoshone | 0.0 /100 | #316 | Tragic 79.3% |
| Comanche | 0.0 /100 | #317 | Tragic 79.2% |
| Chickasaw | 0.0 /100 | #318 | Tragic 79.0% |
| Cherokee | 0.0 /100 | #319 | Tragic 79.0% |
| Yaqui | 0.0 /100 | #320 | Tragic 78.9% |
| Yup'ik | 0.0 /100 | #321 | Tragic 78.6% |
| Crow | 0.0 /100 | #322 | Tragic 78.3% |
Demographics Similar to Bahamians by In Labor Force | Age 45-54
In terms of in labor force | age 45-54, the demographic groups most similar to Bahamians are Panamanian (82.2%, a difference of 0.010%), Immigrants from Ecuador (82.2%, a difference of 0.010%), French (82.2%, a difference of 0.030%), Immigrants (82.1%, a difference of 0.030%), and English (82.2%, a difference of 0.050%).
| Demographics | Rating | Rank | In Labor Force | Age 45-54 |
| Immigrants | Uzbekistan | 5.8 /100 | #213 | Tragic 82.3% |
| Immigrants | Panama | 5.6 /100 | #214 | Tragic 82.2% |
| Iraqis | 5.6 /100 | #215 | Tragic 82.2% |
| Scottish | 5.3 /100 | #216 | Tragic 82.2% |
| Portuguese | 4.7 /100 | #217 | Tragic 82.2% |
| English | 4.4 /100 | #218 | Tragic 82.2% |
| French | 4.1 /100 | #219 | Tragic 82.2% |
| Bahamians | 3.6 /100 | #220 | Tragic 82.2% |
| Panamanians | 3.5 /100 | #221 | Tragic 82.2% |
| Immigrants | Ecuador | 3.4 /100 | #222 | Tragic 82.2% |
| Immigrants | Immigrants | 3.1 /100 | #223 | Tragic 82.1% |
| Immigrants | Jamaica | 2.7 /100 | #224 | Tragic 82.1% |
| Immigrants | Oceania | 2.5 /100 | #225 | Tragic 82.1% |
| Immigrants | Caribbean | 2.5 /100 | #226 | Tragic 82.1% |
| Immigrants | Germany | 2.4 /100 | #227 | Tragic 82.1% |