Cree vs Bahamian Cognitive Disability
COMPARE
Cree
Bahamian
Cognitive Disability
Cognitive Disability Comparison
Cree
Bahamians
17.9%
COGNITIVE DISABILITY
0.7/ 100
METRIC RATING
249th/ 347
METRIC RANK
17.9%
COGNITIVE DISABILITY
0.6/ 100
METRIC RATING
256th/ 347
METRIC RANK
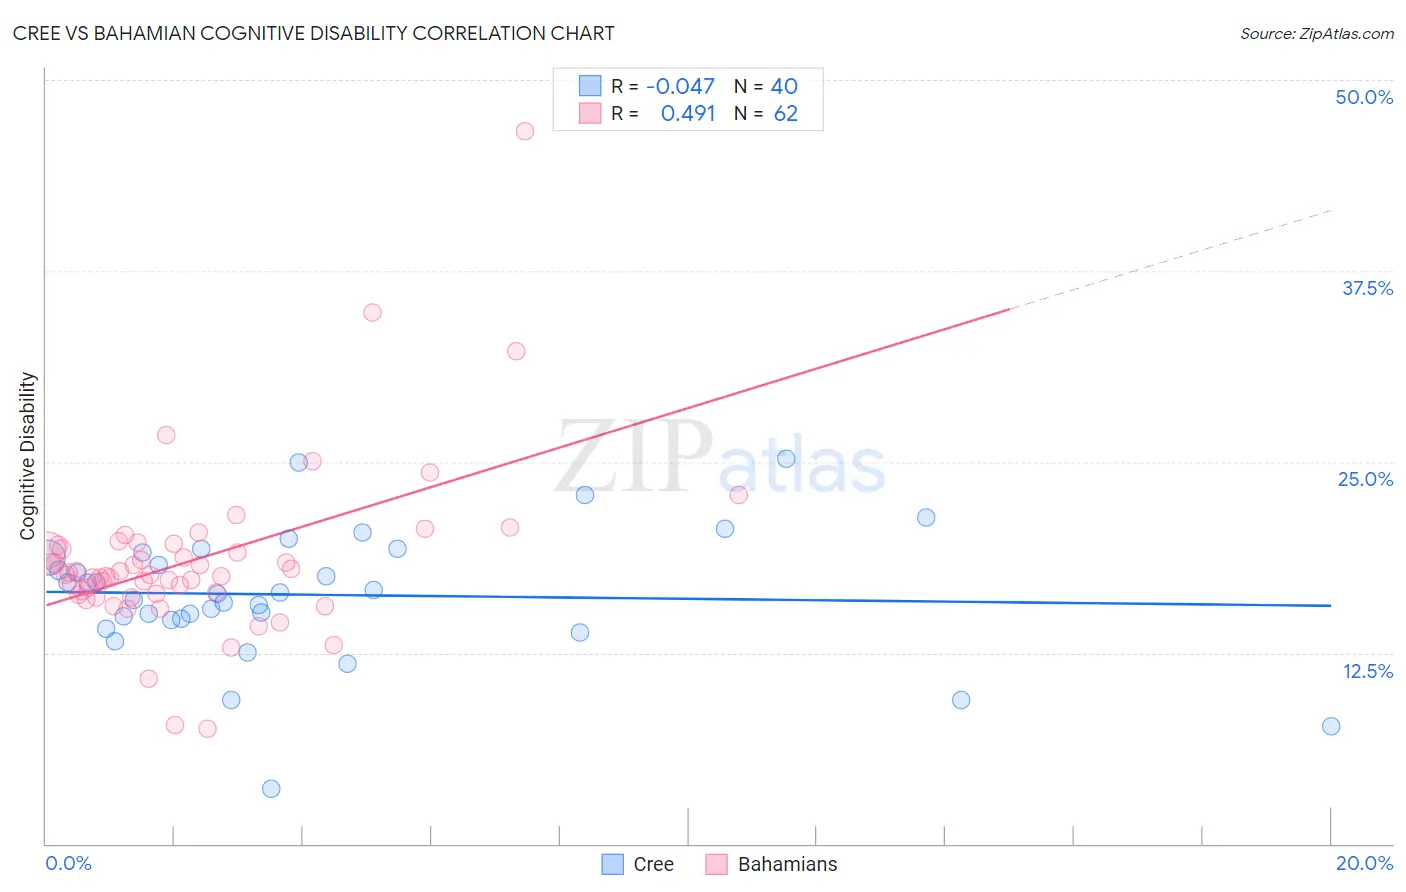
Cree vs Bahamian Cognitive Disability Correlation Chart
The statistical analysis conducted on geographies consisting of 76,210,632 people shows no correlation between the proportion of Cree and percentage of population with cognitive disability in the United States with a correlation coefficient (R) of -0.047 and weighted average of 17.9%. Similarly, the statistical analysis conducted on geographies consisting of 112,674,908 people shows a moderate positive correlation between the proportion of Bahamians and percentage of population with cognitive disability in the United States with a correlation coefficient (R) of 0.491 and weighted average of 17.9%, a difference of 0.040%.
Cognitive Disability Correlation Summary
| Measurement | Cree | Bahamian |
| Minimum | 3.6% | 7.5% |
| Maximum | 25.2% | 46.6% |
| Range | 21.7% | 39.1% |
| Mean | 16.3% | 18.6% |
| Median | 16.4% | 17.6% |
| Interquartile 25% (IQ1) | 14.7% | 16.4% |
| Interquartile 75% (IQ3) | 18.9% | 19.6% |
| Interquartile Range (IQR) | 4.2% | 3.2% |
| Standard Deviation (Sample) | 4.3% | 5.6% |
| Standard Deviation (Population) | 4.2% | 5.6% |
Demographics Similar to Cree and Bahamians by Cognitive Disability
In terms of cognitive disability, the demographic groups most similar to Cree are Immigrants from Ethiopia (17.9%, a difference of 0.0%), Malaysian (17.9%, a difference of 0.010%), Immigrants from Grenada (17.9%, a difference of 0.020%), Hopi (17.9%, a difference of 0.030%), and Hispanic or Latino (17.9%, a difference of 0.030%). Similarly, the demographic groups most similar to Bahamians are Immigrants from the Azores (17.9%, a difference of 0.0%), Hopi (17.9%, a difference of 0.010%), Hispanic or Latino (17.9%, a difference of 0.010%), Immigrants from Grenada (17.9%, a difference of 0.020%), and Malaysian (17.9%, a difference of 0.030%).
| Demographics | Rating | Rank | Cognitive Disability |
| Paiute | 1.1 /100 | #242 | Tragic 17.8% |
| Immigrants | Bangladesh | 1.0 /100 | #243 | Tragic 17.8% |
| Jamaicans | 0.9 /100 | #244 | Tragic 17.9% |
| Trinidadians and Tobagonians | 0.8 /100 | #245 | Tragic 17.9% |
| Immigrants | Thailand | 0.8 /100 | #246 | Tragic 17.9% |
| Samoans | 0.7 /100 | #247 | Tragic 17.9% |
| French American Indians | 0.7 /100 | #248 | Tragic 17.9% |
| Cree | 0.7 /100 | #249 | Tragic 17.9% |
| Immigrants | Ethiopia | 0.7 /100 | #250 | Tragic 17.9% |
| Malaysians | 0.6 /100 | #251 | Tragic 17.9% |
| Immigrants | Grenada | 0.6 /100 | #252 | Tragic 17.9% |
| Hopi | 0.6 /100 | #253 | Tragic 17.9% |
| Hispanics or Latinos | 0.6 /100 | #254 | Tragic 17.9% |
| Immigrants | Azores | 0.6 /100 | #255 | Tragic 17.9% |
| Bahamians | 0.6 /100 | #256 | Tragic 17.9% |
| Mexican American Indians | 0.6 /100 | #257 | Tragic 17.9% |
| Immigrants | Armenia | 0.6 /100 | #258 | Tragic 17.9% |
| Ethiopians | 0.5 /100 | #259 | Tragic 17.9% |
| Immigrants | Belize | 0.5 /100 | #260 | Tragic 17.9% |
| Guamanians/Chamorros | 0.5 /100 | #261 | Tragic 17.9% |
| Sierra Leoneans | 0.4 /100 | #262 | Tragic 17.9% |