Black/African American vs Slovak Ambulatory Disability
COMPARE
Black/African American
Slovak
Ambulatory Disability
Ambulatory Disability Comparison
Blacks/African Americans
Slovaks
7.5%
AMBULATORY DISABILITY
0.0/ 100
METRIC RATING
326th/ 347
METRIC RANK
6.7%
AMBULATORY DISABILITY
0.1/ 100
METRIC RATING
270th/ 347
METRIC RANK
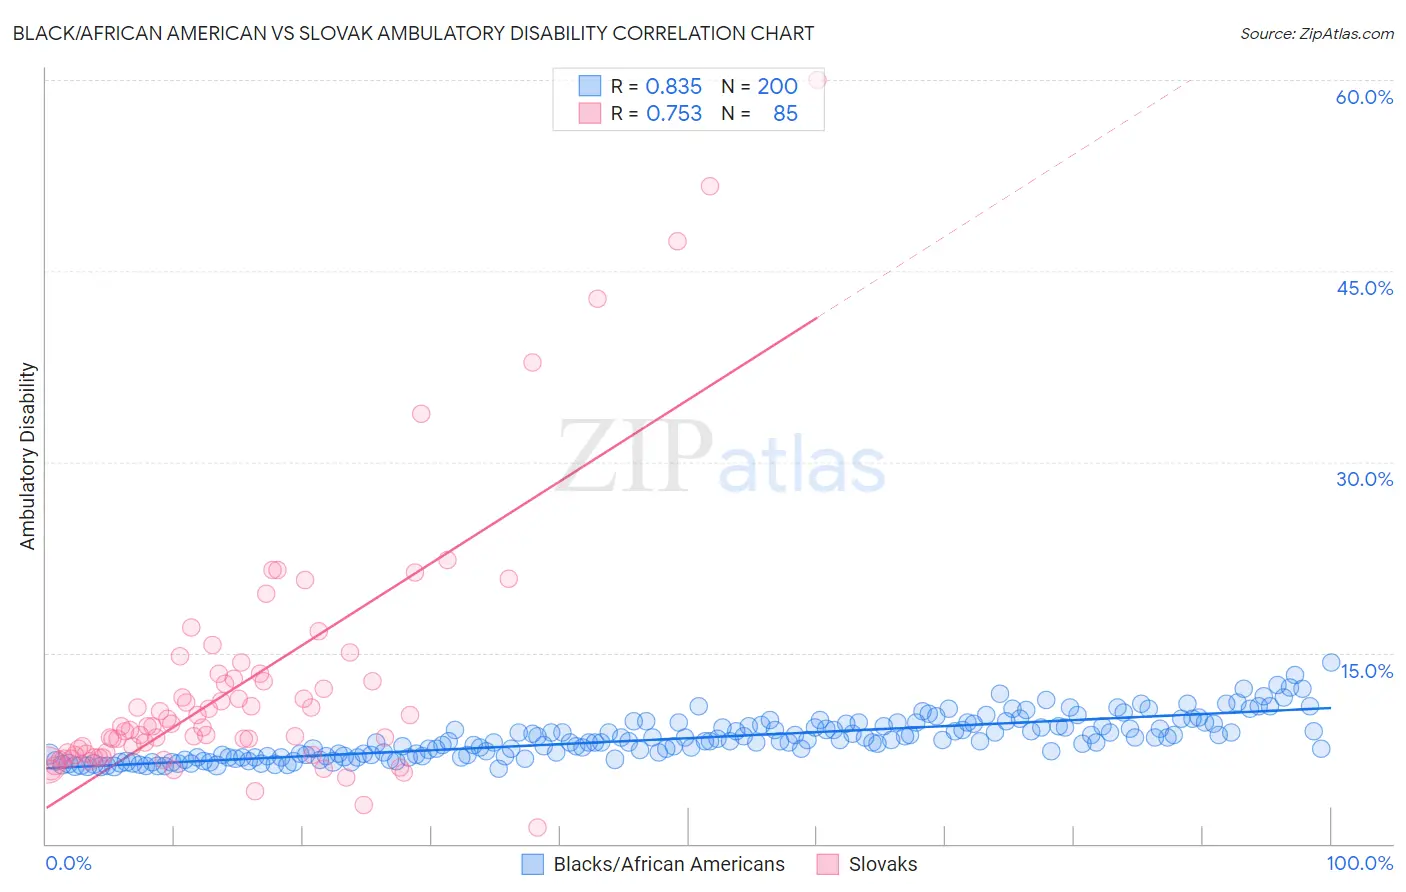
Black/African American vs Slovak Ambulatory Disability Correlation Chart
The statistical analysis conducted on geographies consisting of 565,519,006 people shows a very strong positive correlation between the proportion of Blacks/African Americans and percentage of population with ambulatory disability in the United States with a correlation coefficient (R) of 0.835 and weighted average of 7.5%. Similarly, the statistical analysis conducted on geographies consisting of 397,780,873 people shows a strong positive correlation between the proportion of Slovaks and percentage of population with ambulatory disability in the United States with a correlation coefficient (R) of 0.753 and weighted average of 6.7%, a difference of 12.9%.
Ambulatory Disability Correlation Summary
| Measurement | Black/African American | Slovak |
| Minimum | 5.9% | 1.3% |
| Maximum | 14.3% | 60.0% |
| Range | 8.4% | 58.7% |
| Mean | 8.3% | 12.6% |
| Median | 8.1% | 9.2% |
| Interquartile 25% (IQ1) | 6.9% | 7.0% |
| Interquartile 75% (IQ3) | 9.3% | 13.2% |
| Interquartile Range (IQR) | 2.4% | 6.1% |
| Standard Deviation (Sample) | 1.6% | 10.4% |
| Standard Deviation (Population) | 1.6% | 10.3% |
Similar Demographics by Ambulatory Disability
Demographics Similar to Blacks/African Americans by Ambulatory Disability
In terms of ambulatory disability, the demographic groups most similar to Blacks/African Americans are Native/Alaskan (7.5%, a difference of 0.010%), Comanche (7.5%, a difference of 0.11%), Navajo (7.5%, a difference of 0.18%), Hopi (7.6%, a difference of 0.95%), and Pueblo (7.6%, a difference of 0.99%).
| Demographics | Rating | Rank | Ambulatory Disability |
| Dominicans | 0.0 /100 | #319 | Tragic 7.2% |
| Potawatomi | 0.0 /100 | #320 | Tragic 7.3% |
| Apache | 0.0 /100 | #321 | Tragic 7.4% |
| Osage | 0.0 /100 | #322 | Tragic 7.4% |
| Americans | 0.0 /100 | #323 | Tragic 7.4% |
| Navajo | 0.0 /100 | #324 | Tragic 7.5% |
| Comanche | 0.0 /100 | #325 | Tragic 7.5% |
| Blacks/African Americans | 0.0 /100 | #326 | Tragic 7.5% |
| Natives/Alaskans | 0.0 /100 | #327 | Tragic 7.5% |
| Hopi | 0.0 /100 | #328 | Tragic 7.6% |
| Pueblo | 0.0 /100 | #329 | Tragic 7.6% |
| Paiute | 0.0 /100 | #330 | Tragic 7.7% |
| Cajuns | 0.0 /100 | #331 | Tragic 7.8% |
| Menominee | 0.0 /100 | #332 | Tragic 7.8% |
| Cherokee | 0.0 /100 | #333 | Tragic 7.9% |
Demographics Similar to Slovaks by Ambulatory Disability
In terms of ambulatory disability, the demographic groups most similar to Slovaks are Immigrants from Trinidad and Tobago (6.7%, a difference of 0.10%), French (6.6%, a difference of 0.16%), French Canadian (6.7%, a difference of 0.46%), Spanish (6.6%, a difference of 0.47%), and Trinidadian and Tobagonian (6.6%, a difference of 0.48%).
| Demographics | Rating | Rank | Ambulatory Disability |
| Hmong | 0.3 /100 | #263 | Tragic 6.6% |
| Nepalese | 0.2 /100 | #264 | Tragic 6.6% |
| Bahamians | 0.2 /100 | #265 | Tragic 6.6% |
| Guyanese | 0.2 /100 | #266 | Tragic 6.6% |
| Trinidadians and Tobagonians | 0.2 /100 | #267 | Tragic 6.6% |
| Spanish | 0.2 /100 | #268 | Tragic 6.6% |
| French | 0.1 /100 | #269 | Tragic 6.6% |
| Slovaks | 0.1 /100 | #270 | Tragic 6.7% |
| Immigrants | Trinidad and Tobago | 0.1 /100 | #271 | Tragic 6.7% |
| French Canadians | 0.1 /100 | #272 | Tragic 6.7% |
| Whites/Caucasians | 0.1 /100 | #273 | Tragic 6.7% |
| Sioux | 0.1 /100 | #274 | Tragic 6.7% |
| Immigrants | Guyana | 0.1 /100 | #275 | Tragic 6.7% |
| Celtics | 0.1 /100 | #276 | Tragic 6.7% |
| Jamaicans | 0.1 /100 | #277 | Tragic 6.7% |