Blackfeet vs Jordanian Self-Care Disability
COMPARE
Blackfeet
Jordanian
Self-Care Disability
Self-Care Disability Comparison
Blackfeet
Jordanians
2.7%
SELF-CARE DISABILITY
0.0/ 100
METRIC RATING
294th/ 347
METRIC RANK
2.3%
SELF-CARE DISABILITY
99.7/ 100
METRIC RATING
47th/ 347
METRIC RANK
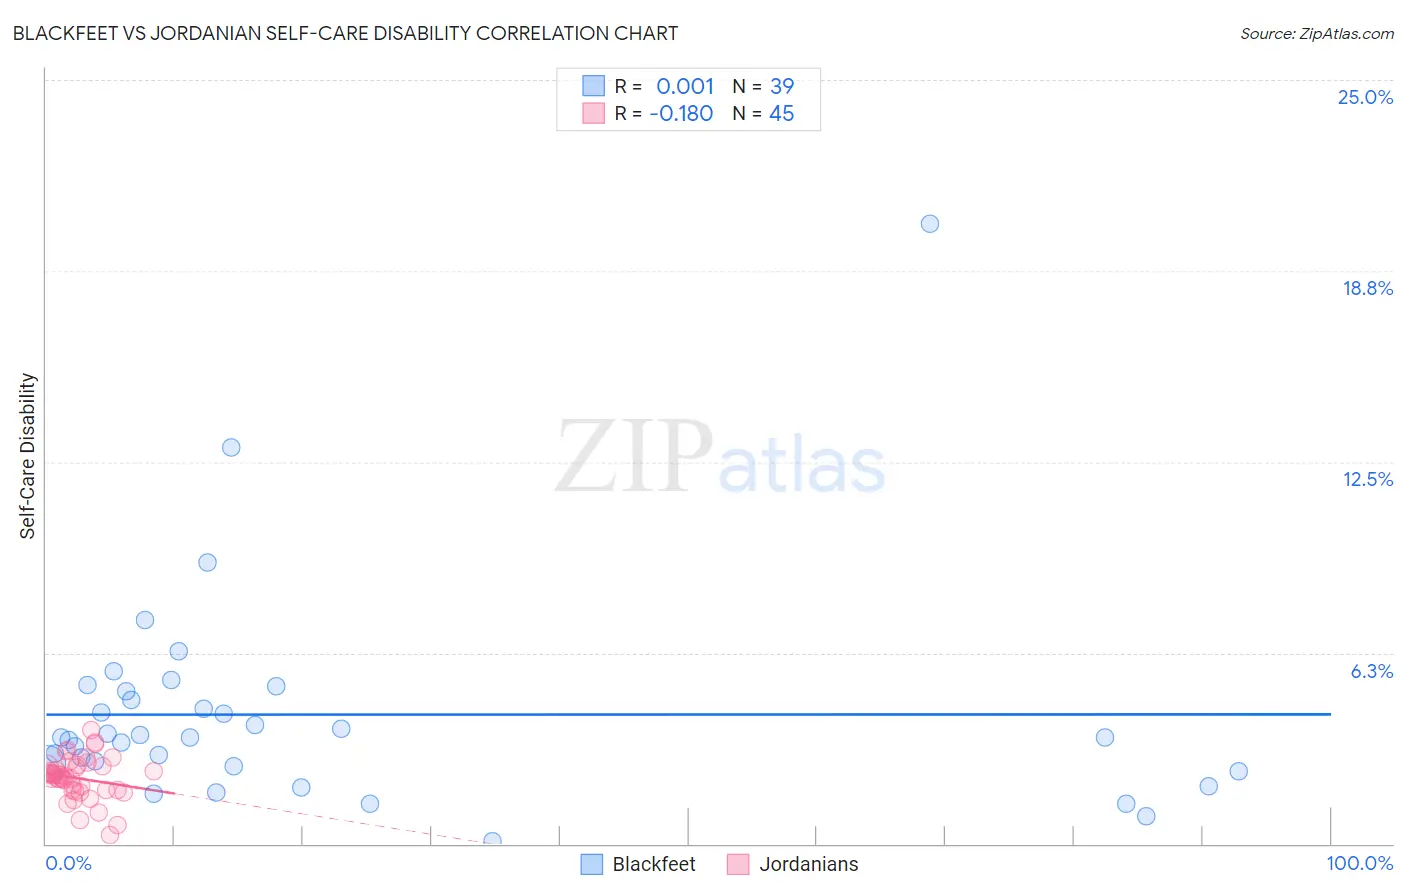
Blackfeet vs Jordanian Self-Care Disability Correlation Chart
The statistical analysis conducted on geographies consisting of 309,304,153 people shows no correlation between the proportion of Blackfeet and percentage of population with self-care disability in the United States with a correlation coefficient (R) of 0.001 and weighted average of 2.7%. Similarly, the statistical analysis conducted on geographies consisting of 166,373,634 people shows a poor negative correlation between the proportion of Jordanians and percentage of population with self-care disability in the United States with a correlation coefficient (R) of -0.180 and weighted average of 2.3%, a difference of 19.7%.
Self-Care Disability Correlation Summary
| Measurement | Blackfeet | Jordanian |
| Minimum | 0.092% | 0.31% |
| Maximum | 20.3% | 3.7% |
| Range | 20.2% | 3.4% |
| Mean | 4.2% | 2.1% |
| Median | 3.5% | 2.2% |
| Interquartile 25% (IQ1) | 2.5% | 1.8% |
| Interquartile 75% (IQ3) | 5.0% | 2.5% |
| Interquartile Range (IQR) | 2.5% | 0.75% |
| Standard Deviation (Sample) | 3.5% | 0.69% |
| Standard Deviation (Population) | 3.5% | 0.68% |
Similar Demographics by Self-Care Disability
Demographics Similar to Blackfeet by Self-Care Disability
In terms of self-care disability, the demographic groups most similar to Blackfeet are Central American Indian (2.7%, a difference of 0.010%), Belizean (2.7%, a difference of 0.010%), Barbadian (2.7%, a difference of 0.14%), Guyanese (2.7%, a difference of 0.16%), and Cuban (2.7%, a difference of 0.43%).
| Demographics | Rating | Rank | Self-Care Disability |
| Immigrants | Jamaica | 0.0 /100 | #287 | Tragic 2.7% |
| Immigrants | Barbados | 0.0 /100 | #288 | Tragic 2.7% |
| Africans | 0.0 /100 | #289 | Tragic 2.7% |
| Cubans | 0.0 /100 | #290 | Tragic 2.7% |
| Guyanese | 0.0 /100 | #291 | Tragic 2.7% |
| Central American Indians | 0.0 /100 | #292 | Tragic 2.7% |
| Belizeans | 0.0 /100 | #293 | Tragic 2.7% |
| Blackfeet | 0.0 /100 | #294 | Tragic 2.7% |
| Barbadians | 0.0 /100 | #295 | Tragic 2.7% |
| Immigrants | Portugal | 0.0 /100 | #296 | Tragic 2.8% |
| West Indians | 0.0 /100 | #297 | Tragic 2.8% |
| Americans | 0.0 /100 | #298 | Tragic 2.8% |
| Immigrants | Guyana | 0.0 /100 | #299 | Tragic 2.8% |
| Immigrants | Fiji | 0.0 /100 | #300 | Tragic 2.8% |
| Pima | 0.0 /100 | #301 | Tragic 2.8% |
Demographics Similar to Jordanians by Self-Care Disability
In terms of self-care disability, the demographic groups most similar to Jordanians are Immigrants from Malaysia (2.3%, a difference of 0.040%), Latvian (2.3%, a difference of 0.22%), Czech (2.3%, a difference of 0.23%), Immigrants from Brazil (2.3%, a difference of 0.24%), and Norwegian (2.3%, a difference of 0.31%).
| Demographics | Rating | Rank | Self-Care Disability |
| Iranians | 99.8 /100 | #40 | Exceptional 2.3% |
| Immigrants | Sudan | 99.8 /100 | #41 | Exceptional 2.3% |
| Immigrants | Uganda | 99.8 /100 | #42 | Exceptional 2.3% |
| Immigrants | Pakistan | 99.8 /100 | #43 | Exceptional 2.3% |
| Immigrants | South Africa | 99.8 /100 | #44 | Exceptional 2.3% |
| Norwegians | 99.8 /100 | #45 | Exceptional 2.3% |
| Czechs | 99.8 /100 | #46 | Exceptional 2.3% |
| Jordanians | 99.7 /100 | #47 | Exceptional 2.3% |
| Immigrants | Malaysia | 99.7 /100 | #48 | Exceptional 2.3% |
| Latvians | 99.7 /100 | #49 | Exceptional 2.3% |
| Immigrants | Brazil | 99.7 /100 | #50 | Exceptional 2.3% |
| Kenyans | 99.7 /100 | #51 | Exceptional 2.3% |
| Immigrants | Serbia | 99.6 /100 | #52 | Exceptional 2.3% |
| Australians | 99.6 /100 | #53 | Exceptional 2.3% |
| Argentineans | 99.6 /100 | #54 | Exceptional 2.3% |