Blackfeet vs Korean Median Family Income
COMPARE
Blackfeet
Korean
Median Family Income
Median Family Income Comparison
Blackfeet
Koreans
$88,717
MEDIAN FAMILY INCOME
0.1/ 100
METRIC RATING
281st/ 347
METRIC RANK
$110,103
MEDIAN FAMILY INCOME
97.8/ 100
METRIC RATING
94th/ 347
METRIC RANK
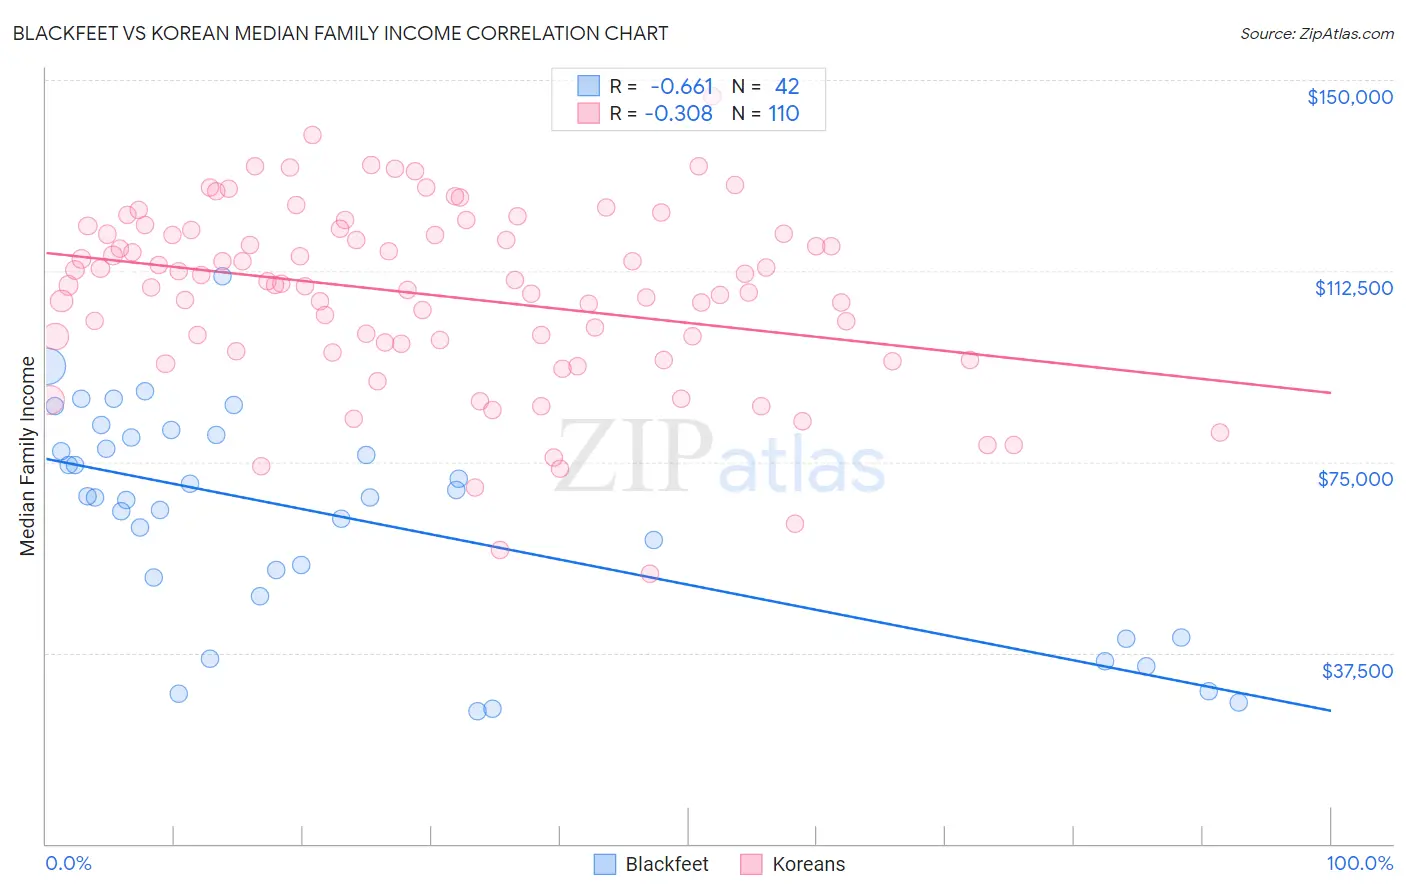
Blackfeet vs Korean Median Family Income Correlation Chart
The statistical analysis conducted on geographies consisting of 309,409,082 people shows a significant negative correlation between the proportion of Blackfeet and median family income in the United States with a correlation coefficient (R) of -0.661 and weighted average of $88,717. Similarly, the statistical analysis conducted on geographies consisting of 510,104,547 people shows a mild negative correlation between the proportion of Koreans and median family income in the United States with a correlation coefficient (R) of -0.308 and weighted average of $110,103, a difference of 24.1%.
Median Family Income Correlation Summary
| Measurement | Blackfeet | Korean |
| Minimum | $26,000 | $53,031 |
| Maximum | $111,536 | $146,906 |
| Range | $85,536 | $93,875 |
| Mean | $63,847 | $107,726 |
| Median | $68,073 | $109,878 |
| Interquartile 25% (IQ1) | $48,694 | $98,078 |
| Interquartile 75% (IQ3) | $79,668 | $119,779 |
| Interquartile Range (IQR) | $30,974 | $21,701 |
| Standard Deviation (Sample) | $21,241 | $17,855 |
| Standard Deviation (Population) | $20,987 | $17,774 |
Similar Demographics by Median Family Income
Demographics Similar to Blackfeet by Median Family Income
In terms of median family income, the demographic groups most similar to Blackfeet are Comanche ($88,556, a difference of 0.18%), British West Indian ($88,987, a difference of 0.30%), Bangladeshi ($88,358, a difference of 0.41%), Indonesian ($88,301, a difference of 0.47%), and Guatemalan ($88,295, a difference of 0.48%).
| Demographics | Rating | Rank | Median Family Income |
| Spanish Americans | 0.2 /100 | #274 | Tragic $90,322 |
| Immigrants | St. Vincent and the Grenadines | 0.2 /100 | #275 | Tragic $90,094 |
| Immigrants | Zaire | 0.1 /100 | #276 | Tragic $89,285 |
| Immigrants | Jamaica | 0.1 /100 | #277 | Tragic $89,268 |
| Immigrants | Grenada | 0.1 /100 | #278 | Tragic $89,249 |
| Immigrants | Belize | 0.1 /100 | #279 | Tragic $89,197 |
| British West Indians | 0.1 /100 | #280 | Tragic $88,987 |
| Blackfeet | 0.1 /100 | #281 | Tragic $88,717 |
| Comanche | 0.1 /100 | #282 | Tragic $88,556 |
| Bangladeshis | 0.1 /100 | #283 | Tragic $88,358 |
| Indonesians | 0.1 /100 | #284 | Tragic $88,301 |
| Guatemalans | 0.1 /100 | #285 | Tragic $88,295 |
| Immigrants | Nicaragua | 0.1 /100 | #286 | Tragic $88,267 |
| Potawatomi | 0.1 /100 | #287 | Tragic $88,265 |
| Cherokee | 0.1 /100 | #288 | Tragic $88,209 |
Demographics Similar to Koreans by Median Family Income
In terms of median family income, the demographic groups most similar to Koreans are Immigrants from Kazakhstan ($110,137, a difference of 0.030%), Immigrants from Lebanon ($110,159, a difference of 0.050%), Zimbabwean ($110,011, a difference of 0.080%), Immigrants from Moldova ($109,975, a difference of 0.12%), and Jordanian ($109,865, a difference of 0.22%).
| Demographics | Rating | Rank | Median Family Income |
| Austrians | 98.8 /100 | #87 | Exceptional $111,306 |
| Romanians | 98.8 /100 | #88 | Exceptional $111,243 |
| Immigrants | Argentina | 98.5 /100 | #89 | Exceptional $110,873 |
| Northern Europeans | 98.3 /100 | #90 | Exceptional $110,635 |
| Immigrants | Southern Europe | 98.3 /100 | #91 | Exceptional $110,614 |
| Immigrants | Lebanon | 97.9 /100 | #92 | Exceptional $110,159 |
| Immigrants | Kazakhstan | 97.8 /100 | #93 | Exceptional $110,137 |
| Koreans | 97.8 /100 | #94 | Exceptional $110,103 |
| Zimbabweans | 97.7 /100 | #95 | Exceptional $110,011 |
| Immigrants | Moldova | 97.7 /100 | #96 | Exceptional $109,975 |
| Jordanians | 97.5 /100 | #97 | Exceptional $109,865 |
| Immigrants | Kuwait | 97.4 /100 | #98 | Exceptional $109,731 |
| Armenians | 97.3 /100 | #99 | Exceptional $109,692 |
| Macedonians | 97.3 /100 | #100 | Exceptional $109,668 |
| Immigrants | Ukraine | 97.2 /100 | #101 | Exceptional $109,645 |