Blackfeet vs Korean Divorced or Separated
COMPARE
Blackfeet
Korean
Divorced or Separated
Divorced or Separated Comparison
Blackfeet
Koreans
13.3%
DIVORCED OR SEPARATED
0.0/ 100
METRIC RATING
312th/ 347
METRIC RANK
11.3%
DIVORCED OR SEPARATED
99.9/ 100
METRIC RATING
61st/ 347
METRIC RANK
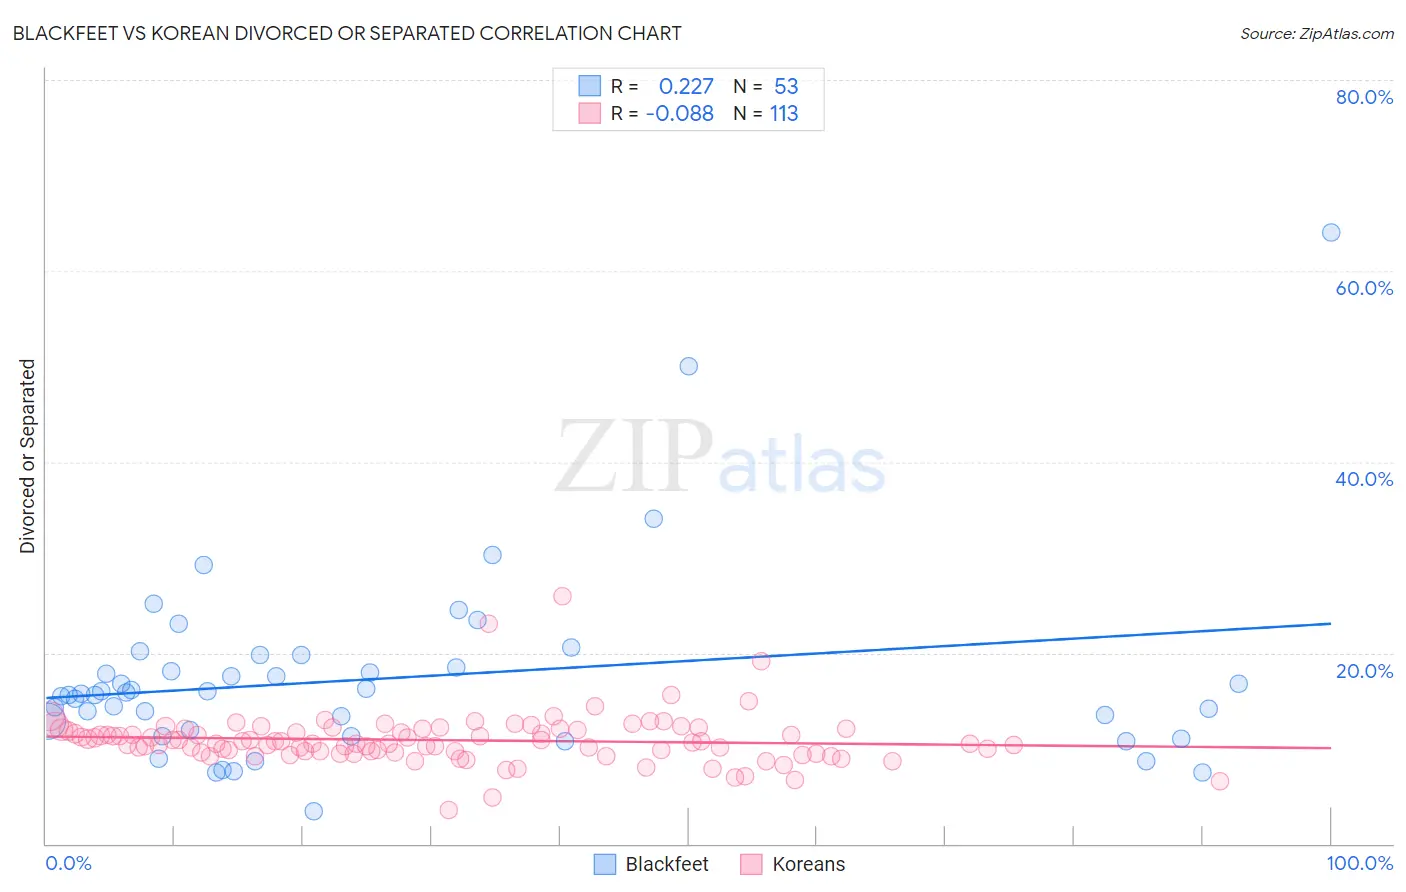
Blackfeet vs Korean Divorced or Separated Correlation Chart
The statistical analysis conducted on geographies consisting of 309,547,647 people shows a weak positive correlation between the proportion of Blackfeet and percentage of population currently divorced or separated in the United States with a correlation coefficient (R) of 0.227 and weighted average of 13.3%. Similarly, the statistical analysis conducted on geographies consisting of 510,579,810 people shows a slight negative correlation between the proportion of Koreans and percentage of population currently divorced or separated in the United States with a correlation coefficient (R) of -0.088 and weighted average of 11.3%, a difference of 17.1%.
Divorced or Separated Correlation Summary
| Measurement | Blackfeet | Korean |
| Minimum | 3.4% | 3.5% |
| Maximum | 64.0% | 25.9% |
| Range | 60.6% | 22.4% |
| Mean | 17.3% | 10.9% |
| Median | 15.7% | 10.6% |
| Interquartile 25% (IQ1) | 11.6% | 9.6% |
| Interquartile 75% (IQ3) | 19.1% | 12.0% |
| Interquartile Range (IQR) | 7.6% | 2.4% |
| Standard Deviation (Sample) | 10.0% | 2.7% |
| Standard Deviation (Population) | 9.9% | 2.7% |
Similar Demographics by Divorced or Separated
Demographics Similar to Blackfeet by Divorced or Separated
In terms of divorced or separated, the demographic groups most similar to Blackfeet are Immigrants from Nicaragua (13.3%, a difference of 0.19%), Yaqui (13.3%, a difference of 0.21%), Sioux (13.2%, a difference of 0.35%), African (13.2%, a difference of 0.37%), and American (13.2%, a difference of 0.39%).
| Demographics | Rating | Rank | Divorced or Separated |
| Chippewa | 0.0 /100 | #305 | Tragic 13.2% |
| Tlingit-Haida | 0.0 /100 | #306 | Tragic 13.2% |
| French American Indians | 0.0 /100 | #307 | Tragic 13.2% |
| Ottawa | 0.0 /100 | #308 | Tragic 13.2% |
| Americans | 0.0 /100 | #309 | Tragic 13.2% |
| Africans | 0.0 /100 | #310 | Tragic 13.2% |
| Sioux | 0.0 /100 | #311 | Tragic 13.2% |
| Blackfeet | 0.0 /100 | #312 | Tragic 13.3% |
| Immigrants | Nicaragua | 0.0 /100 | #313 | Tragic 13.3% |
| Yaqui | 0.0 /100 | #314 | Tragic 13.3% |
| Spanish Americans | 0.0 /100 | #315 | Tragic 13.3% |
| Tsimshian | 0.0 /100 | #316 | Tragic 13.3% |
| Haitians | 0.0 /100 | #317 | Tragic 13.3% |
| Cree | 0.0 /100 | #318 | Tragic 13.4% |
| Puget Sound Salish | 0.0 /100 | #319 | Tragic 13.4% |
Demographics Similar to Koreans by Divorced or Separated
In terms of divorced or separated, the demographic groups most similar to Koreans are Luxembourger (11.3%, a difference of 0.0%), Immigrants from Russia (11.3%, a difference of 0.010%), Immigrants from Kuwait (11.3%, a difference of 0.010%), Israeli (11.3%, a difference of 0.17%), and Sri Lankan (11.3%, a difference of 0.26%).
| Demographics | Rating | Rank | Divorced or Separated |
| Eastern Europeans | 99.9 /100 | #54 | Exceptional 11.3% |
| Immigrants | Yemen | 99.9 /100 | #55 | Exceptional 11.3% |
| Immigrants | Philippines | 99.9 /100 | #56 | Exceptional 11.3% |
| Immigrants | Vietnam | 99.9 /100 | #57 | Exceptional 11.3% |
| Sri Lankans | 99.9 /100 | #58 | Exceptional 11.3% |
| Israelis | 99.9 /100 | #59 | Exceptional 11.3% |
| Immigrants | Russia | 99.9 /100 | #60 | Exceptional 11.3% |
| Koreans | 99.9 /100 | #61 | Exceptional 11.3% |
| Luxembourgers | 99.9 /100 | #62 | Exceptional 11.3% |
| Immigrants | Kuwait | 99.9 /100 | #63 | Exceptional 11.3% |
| Macedonians | 99.8 /100 | #64 | Exceptional 11.4% |
| Immigrants | South Eastern Asia | 99.8 /100 | #65 | Exceptional 11.4% |
| Inupiat | 99.8 /100 | #66 | Exceptional 11.4% |
| Immigrants | Syria | 99.7 /100 | #67 | Exceptional 11.4% |
| Palestinians | 99.7 /100 | #68 | Exceptional 11.5% |