Blackfeet vs Immigrants from Dominican Republic Hearing Disability
COMPARE
Blackfeet
Immigrants from Dominican Republic
Hearing Disability
Hearing Disability Comparison
Blackfeet
Immigrants from Dominican Republic
3.6%
HEARING DISABILITY
0.0/ 100
METRIC RATING
283rd/ 347
METRIC RANK
2.4%
HEARING DISABILITY
100.0/ 100
METRIC RATING
9th/ 347
METRIC RANK
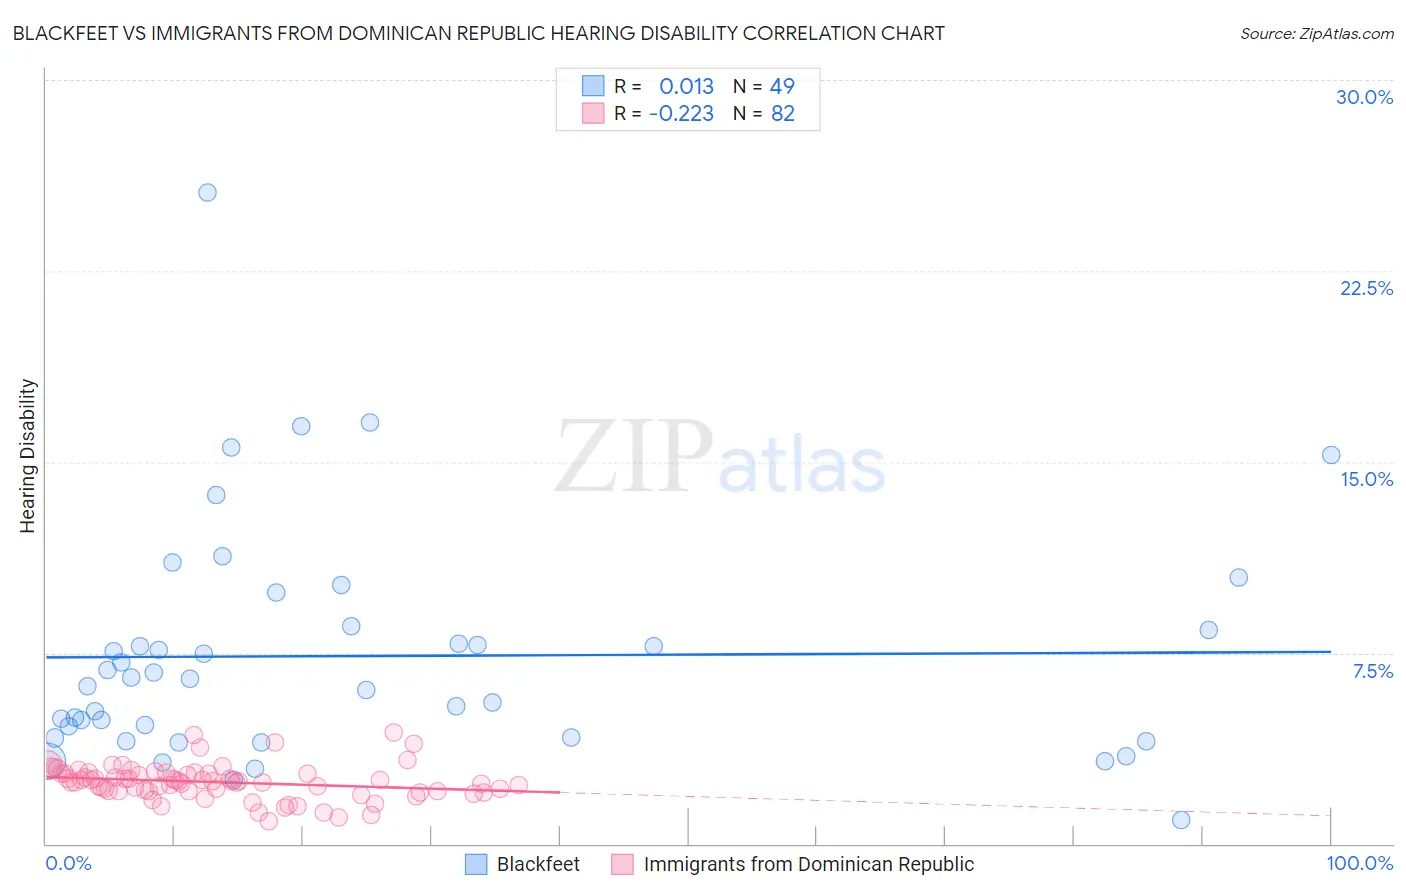
Blackfeet vs Immigrants from Dominican Republic Hearing Disability Correlation Chart
The statistical analysis conducted on geographies consisting of 309,445,553 people shows no correlation between the proportion of Blackfeet and percentage of population with hearing disability in the United States with a correlation coefficient (R) of 0.013 and weighted average of 3.6%. Similarly, the statistical analysis conducted on geographies consisting of 275,054,996 people shows a weak negative correlation between the proportion of Immigrants from Dominican Republic and percentage of population with hearing disability in the United States with a correlation coefficient (R) of -0.223 and weighted average of 2.4%, a difference of 47.8%.
Hearing Disability Correlation Summary
| Measurement | Blackfeet | Immigrants from Dominican Republic |
| Minimum | 0.91% | 0.89% |
| Maximum | 25.6% | 4.4% |
| Range | 24.7% | 3.5% |
| Mean | 7.4% | 2.4% |
| Median | 6.5% | 2.4% |
| Interquartile 25% (IQ1) | 4.2% | 2.1% |
| Interquartile 75% (IQ3) | 8.5% | 2.8% |
| Interquartile Range (IQR) | 4.3% | 0.69% |
| Standard Deviation (Sample) | 4.6% | 0.66% |
| Standard Deviation (Population) | 4.5% | 0.66% |
Similar Demographics by Hearing Disability
Demographics Similar to Blackfeet by Hearing Disability
In terms of hearing disability, the demographic groups most similar to Blackfeet are Swedish (3.6%, a difference of 0.25%), Scandinavian (3.6%, a difference of 0.34%), French American Indian (3.6%, a difference of 0.40%), Slovak (3.6%, a difference of 0.46%), and Immigrants from Micronesia (3.6%, a difference of 0.47%).
| Demographics | Rating | Rank | Hearing Disability |
| Danes | 0.0 /100 | #276 | Tragic 3.6% |
| Immigrants | Nonimmigrants | 0.0 /100 | #277 | Tragic 3.6% |
| Basques | 0.0 /100 | #278 | Tragic 3.6% |
| Slovaks | 0.0 /100 | #279 | Tragic 3.6% |
| French American Indians | 0.0 /100 | #280 | Tragic 3.6% |
| Scandinavians | 0.0 /100 | #281 | Tragic 3.6% |
| Swedes | 0.0 /100 | #282 | Tragic 3.6% |
| Blackfeet | 0.0 /100 | #283 | Tragic 3.6% |
| Immigrants | Micronesia | 0.0 /100 | #284 | Tragic 3.6% |
| Sioux | 0.0 /100 | #285 | Tragic 3.6% |
| Delaware | 0.0 /100 | #286 | Tragic 3.6% |
| Spanish | 0.0 /100 | #287 | Tragic 3.7% |
| Irish | 0.0 /100 | #288 | Tragic 3.7% |
| Chinese | 0.0 /100 | #289 | Tragic 3.7% |
| Whites/Caucasians | 0.0 /100 | #290 | Tragic 3.7% |
Demographics Similar to Immigrants from Dominican Republic by Hearing Disability
In terms of hearing disability, the demographic groups most similar to Immigrants from Dominican Republic are British West Indian (2.4%, a difference of 0.78%), Immigrants from Bangladesh (2.4%, a difference of 1.0%), Immigrants from Ecuador (2.5%, a difference of 1.0%), Immigrants from Trinidad and Tobago (2.5%, a difference of 1.6%), and Trinidadian and Tobagonian (2.5%, a difference of 1.9%).
| Demographics | Rating | Rank | Hearing Disability |
| Immigrants | St. Vincent and the Grenadines | 100.0 /100 | #2 | Exceptional 2.3% |
| Guyanese | 100.0 /100 | #3 | Exceptional 2.3% |
| Immigrants | Guyana | 100.0 /100 | #4 | Exceptional 2.3% |
| Immigrants | Barbados | 100.0 /100 | #5 | Exceptional 2.4% |
| Vietnamese | 100.0 /100 | #6 | Exceptional 2.4% |
| Immigrants | Bangladesh | 100.0 /100 | #7 | Exceptional 2.4% |
| British West Indians | 100.0 /100 | #8 | Exceptional 2.4% |
| Immigrants | Dominican Republic | 100.0 /100 | #9 | Exceptional 2.4% |
| Immigrants | Ecuador | 99.9 /100 | #10 | Exceptional 2.5% |
| Immigrants | Trinidad and Tobago | 99.9 /100 | #11 | Exceptional 2.5% |
| Trinidadians and Tobagonians | 99.9 /100 | #12 | Exceptional 2.5% |
| Sierra Leoneans | 99.9 /100 | #13 | Exceptional 2.5% |
| Ecuadorians | 99.9 /100 | #14 | Exceptional 2.5% |
| Barbadians | 99.9 /100 | #15 | Exceptional 2.5% |
| Immigrants | West Indies | 99.9 /100 | #16 | Exceptional 2.5% |