Blackfeet vs Immigrants from Philippines Hearing Disability
COMPARE
Blackfeet
Immigrants from Philippines
Hearing Disability
Hearing Disability Comparison
Blackfeet
Immigrants from Philippines
3.6%
HEARING DISABILITY
0.0/ 100
METRIC RATING
283rd/ 347
METRIC RANK
3.0%
HEARING DISABILITY
46.4/ 100
METRIC RATING
177th/ 347
METRIC RANK
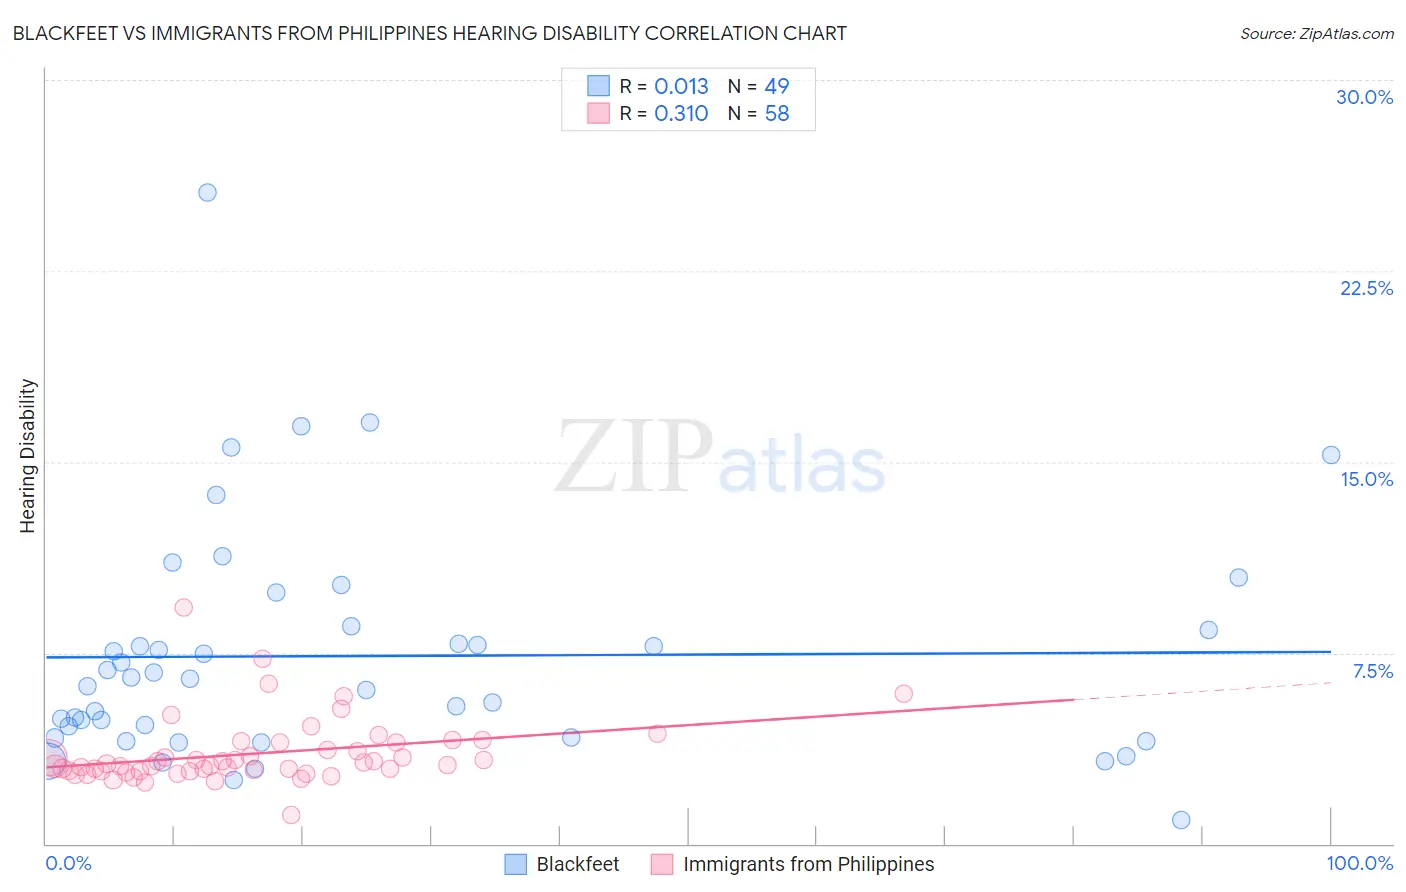
Blackfeet vs Immigrants from Philippines Hearing Disability Correlation Chart
The statistical analysis conducted on geographies consisting of 309,445,553 people shows no correlation between the proportion of Blackfeet and percentage of population with hearing disability in the United States with a correlation coefficient (R) of 0.013 and weighted average of 3.6%. Similarly, the statistical analysis conducted on geographies consisting of 471,004,648 people shows a mild positive correlation between the proportion of Immigrants from Philippines and percentage of population with hearing disability in the United States with a correlation coefficient (R) of 0.310 and weighted average of 3.0%, a difference of 20.5%.
Hearing Disability Correlation Summary
| Measurement | Blackfeet | Immigrants from Philippines |
| Minimum | 0.91% | 1.1% |
| Maximum | 25.6% | 9.3% |
| Range | 24.7% | 8.2% |
| Mean | 7.4% | 3.5% |
| Median | 6.5% | 3.1% |
| Interquartile 25% (IQ1) | 4.2% | 2.8% |
| Interquartile 75% (IQ3) | 8.5% | 4.0% |
| Interquartile Range (IQR) | 4.3% | 1.1% |
| Standard Deviation (Sample) | 4.6% | 1.3% |
| Standard Deviation (Population) | 4.5% | 1.3% |
Similar Demographics by Hearing Disability
Demographics Similar to Blackfeet by Hearing Disability
In terms of hearing disability, the demographic groups most similar to Blackfeet are Swedish (3.6%, a difference of 0.25%), Scandinavian (3.6%, a difference of 0.34%), French American Indian (3.6%, a difference of 0.40%), Slovak (3.6%, a difference of 0.46%), and Immigrants from Micronesia (3.6%, a difference of 0.47%).
| Demographics | Rating | Rank | Hearing Disability |
| Danes | 0.0 /100 | #276 | Tragic 3.6% |
| Immigrants | Nonimmigrants | 0.0 /100 | #277 | Tragic 3.6% |
| Basques | 0.0 /100 | #278 | Tragic 3.6% |
| Slovaks | 0.0 /100 | #279 | Tragic 3.6% |
| French American Indians | 0.0 /100 | #280 | Tragic 3.6% |
| Scandinavians | 0.0 /100 | #281 | Tragic 3.6% |
| Swedes | 0.0 /100 | #282 | Tragic 3.6% |
| Blackfeet | 0.0 /100 | #283 | Tragic 3.6% |
| Immigrants | Micronesia | 0.0 /100 | #284 | Tragic 3.6% |
| Sioux | 0.0 /100 | #285 | Tragic 3.6% |
| Delaware | 0.0 /100 | #286 | Tragic 3.6% |
| Spanish | 0.0 /100 | #287 | Tragic 3.7% |
| Irish | 0.0 /100 | #288 | Tragic 3.7% |
| Chinese | 0.0 /100 | #289 | Tragic 3.7% |
| Whites/Caucasians | 0.0 /100 | #290 | Tragic 3.7% |
Demographics Similar to Immigrants from Philippines by Hearing Disability
In terms of hearing disability, the demographic groups most similar to Immigrants from Philippines are Japanese (3.0%, a difference of 0.040%), Panamanian (3.0%, a difference of 0.060%), Immigrants from Romania (3.0%, a difference of 0.20%), Immigrants from Moldova (3.0%, a difference of 0.31%), and Indonesian (3.0%, a difference of 0.34%).
| Demographics | Rating | Rank | Hearing Disability |
| Immigrants | Cabo Verde | 56.9 /100 | #170 | Average 3.0% |
| Immigrants | Ukraine | 56.6 /100 | #171 | Average 3.0% |
| Armenians | 56.0 /100 | #172 | Average 3.0% |
| Immigrants | Serbia | 51.1 /100 | #173 | Average 3.0% |
| Indonesians | 50.0 /100 | #174 | Average 3.0% |
| Immigrants | Romania | 48.4 /100 | #175 | Average 3.0% |
| Panamanians | 47.0 /100 | #176 | Average 3.0% |
| Immigrants | Philippines | 46.4 /100 | #177 | Average 3.0% |
| Japanese | 46.0 /100 | #178 | Average 3.0% |
| Immigrants | Moldova | 43.1 /100 | #179 | Average 3.0% |
| Immigrants | Sweden | 42.4 /100 | #180 | Average 3.0% |
| Immigrants | Belgium | 41.5 /100 | #181 | Average 3.0% |
| Immigrants | Italy | 41.1 /100 | #182 | Average 3.0% |
| Bulgarians | 39.7 /100 | #183 | Fair 3.0% |
| Immigrants | Ireland | 37.4 /100 | #184 | Fair 3.0% |