Blackfeet vs Senegalese Hearing Disability
COMPARE
Blackfeet
Senegalese
Hearing Disability
Hearing Disability Comparison
Blackfeet
Senegalese
3.6%
HEARING DISABILITY
0.0/ 100
METRIC RATING
283rd/ 347
METRIC RANK
2.6%
HEARING DISABILITY
99.4/ 100
METRIC RATING
43rd/ 347
METRIC RANK
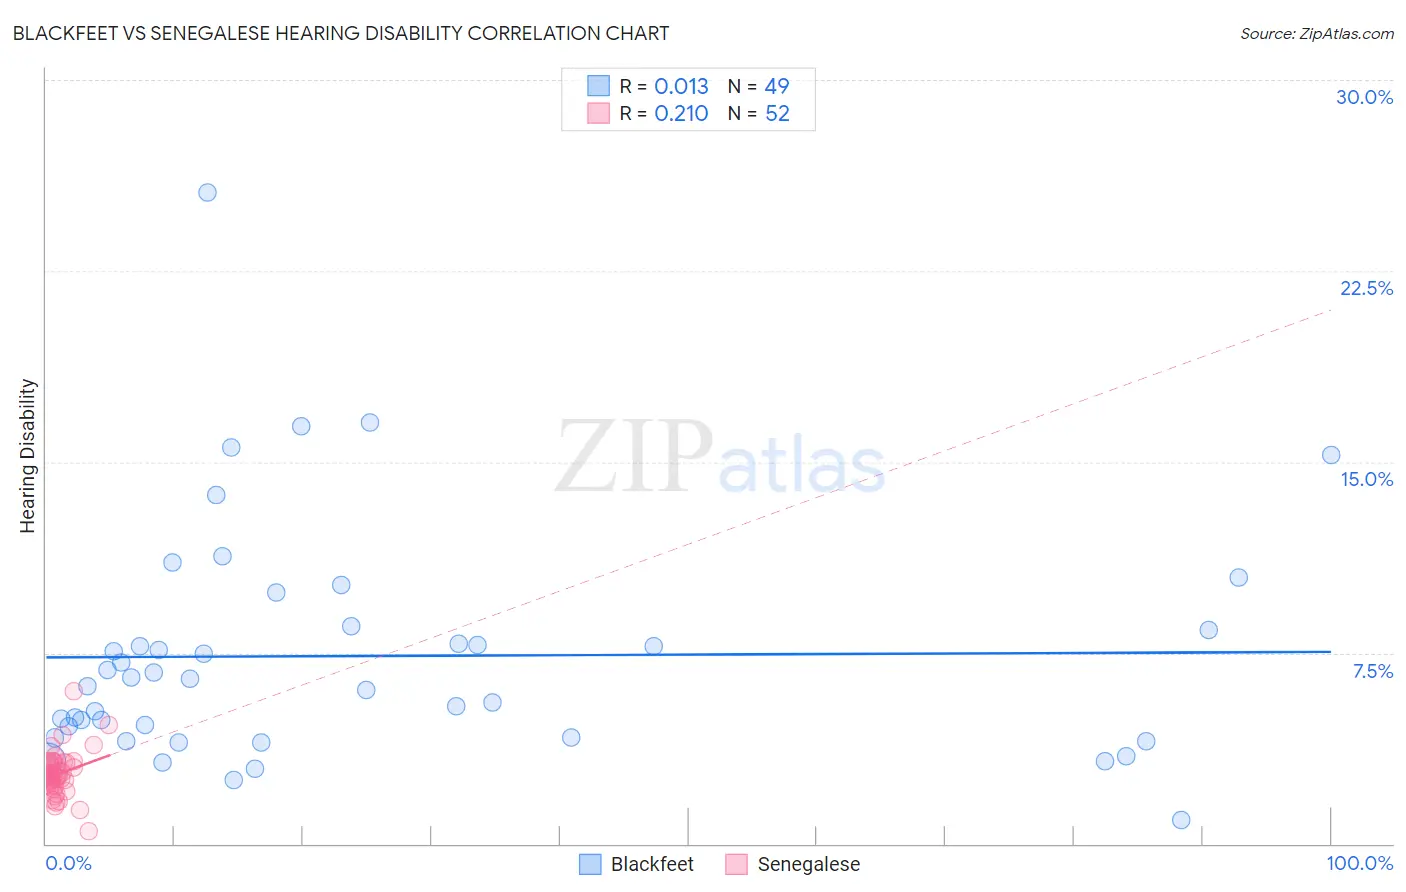
Blackfeet vs Senegalese Hearing Disability Correlation Chart
The statistical analysis conducted on geographies consisting of 309,445,553 people shows no correlation between the proportion of Blackfeet and percentage of population with hearing disability in the United States with a correlation coefficient (R) of 0.013 and weighted average of 3.6%. Similarly, the statistical analysis conducted on geographies consisting of 78,133,059 people shows a weak positive correlation between the proportion of Senegalese and percentage of population with hearing disability in the United States with a correlation coefficient (R) of 0.210 and weighted average of 2.6%, a difference of 37.4%.
Hearing Disability Correlation Summary
| Measurement | Blackfeet | Senegalese |
| Minimum | 0.91% | 0.50% |
| Maximum | 25.6% | 6.0% |
| Range | 24.7% | 5.5% |
| Mean | 7.4% | 2.7% |
| Median | 6.5% | 2.7% |
| Interquartile 25% (IQ1) | 4.2% | 2.4% |
| Interquartile 75% (IQ3) | 8.5% | 3.2% |
| Interquartile Range (IQR) | 4.3% | 0.80% |
| Standard Deviation (Sample) | 4.6% | 0.85% |
| Standard Deviation (Population) | 4.5% | 0.84% |
Similar Demographics by Hearing Disability
Demographics Similar to Blackfeet by Hearing Disability
In terms of hearing disability, the demographic groups most similar to Blackfeet are Swedish (3.6%, a difference of 0.25%), Scandinavian (3.6%, a difference of 0.34%), French American Indian (3.6%, a difference of 0.40%), Slovak (3.6%, a difference of 0.46%), and Immigrants from Micronesia (3.6%, a difference of 0.47%).
| Demographics | Rating | Rank | Hearing Disability |
| Danes | 0.0 /100 | #276 | Tragic 3.6% |
| Immigrants | Nonimmigrants | 0.0 /100 | #277 | Tragic 3.6% |
| Basques | 0.0 /100 | #278 | Tragic 3.6% |
| Slovaks | 0.0 /100 | #279 | Tragic 3.6% |
| French American Indians | 0.0 /100 | #280 | Tragic 3.6% |
| Scandinavians | 0.0 /100 | #281 | Tragic 3.6% |
| Swedes | 0.0 /100 | #282 | Tragic 3.6% |
| Blackfeet | 0.0 /100 | #283 | Tragic 3.6% |
| Immigrants | Micronesia | 0.0 /100 | #284 | Tragic 3.6% |
| Sioux | 0.0 /100 | #285 | Tragic 3.6% |
| Delaware | 0.0 /100 | #286 | Tragic 3.6% |
| Spanish | 0.0 /100 | #287 | Tragic 3.7% |
| Irish | 0.0 /100 | #288 | Tragic 3.7% |
| Chinese | 0.0 /100 | #289 | Tragic 3.7% |
| Whites/Caucasians | 0.0 /100 | #290 | Tragic 3.7% |
Demographics Similar to Senegalese by Hearing Disability
In terms of hearing disability, the demographic groups most similar to Senegalese are Immigrants from Taiwan (2.6%, a difference of 0.010%), West Indian (2.6%, a difference of 0.010%), Nigerian (2.6%, a difference of 0.22%), Venezuelan (2.6%, a difference of 0.25%), and Haitian (2.6%, a difference of 0.35%).
| Demographics | Rating | Rank | Hearing Disability |
| Okinawans | 99.6 /100 | #36 | Exceptional 2.6% |
| Immigrants | Western Africa | 99.6 /100 | #37 | Exceptional 2.6% |
| Immigrants | Jamaica | 99.5 /100 | #38 | Exceptional 2.6% |
| Immigrants | China | 99.5 /100 | #39 | Exceptional 2.6% |
| Haitians | 99.5 /100 | #40 | Exceptional 2.6% |
| Immigrants | Taiwan | 99.4 /100 | #41 | Exceptional 2.6% |
| West Indians | 99.4 /100 | #42 | Exceptional 2.6% |
| Senegalese | 99.4 /100 | #43 | Exceptional 2.6% |
| Nigerians | 99.4 /100 | #44 | Exceptional 2.6% |
| Venezuelans | 99.4 /100 | #45 | Exceptional 2.6% |
| Immigrants | Dominica | 99.3 /100 | #46 | Exceptional 2.6% |
| Immigrants | Israel | 99.3 /100 | #47 | Exceptional 2.6% |
| Immigrants | Singapore | 99.3 /100 | #48 | Exceptional 2.6% |
| Immigrants | South America | 99.2 /100 | #49 | Exceptional 2.7% |
| Paraguayans | 99.2 /100 | #50 | Exceptional 2.7% |